

This tutorial will cover the creation of a web application written in Python using Flask. The web application will make use of the EODHD API’s Python library to supply the data. Users will be able to browse the API data through their browser, beautifully presented using Bootstrap tables. This article will cover the creation of the Python Flask dev project, retrieving the list of exchanges, drilling down into the exchange data to retrieve the markets, and then finally drilling down into the market to retrieve the hourly data for the market. The pages will use breadcrumbs to allow for easy navigation back and forth. Data will be presented using a Bootstrap data table that will natively allow for searching, sorting, filtering, and more.
Quick jump:
Prerequisites
- Obtain an API Token from EODHD APIs.
- Install a current version of Python. A helpful guide can be found on Real Python.
- Install an IDE like Visual Studio Code.
- Create yourself a project directory.
Directory and File Structure
The initial directory and file structure will look like this:
.
|____requirements.txt
|____app.py
|____config.py
|____api
| |______init__.py
| |____financial_data.py
|____templates
| |____exchanges.html
A lot more will be added to this, but this is our initial starting point. It will be easier to explain this in stages.
File Contents
requirements.txt
flask
eodhd
This file is used to define the library dependencies we need to install, primarily “flask” and “eodhd”. The way we install the library dependencies is as follows:
% python3 -m pip install -r requirements.txt -Uconfig.py
API_TOKEN = "YOUR_TOKEN"This file only needs to contain your API TOKEN from EODHD APIs.
1. Use the “demo” API key to test our data from a limited set of tickers without registering:
AAPL.US | TSLA.US | VTI.US | AMZN.US | BTC-USD | EUR-USD
Real-Time Data and all of the APIs (except Bulk) are included without API calls limitations with these tickers and the demo key.
2. Register to get your free API key (limited to 20 API calls per day) with access to:
End-Of-Day Historical Data with only the past year for any ticker, and the List of tickers per Exchange.
3. To unlock your API key, we recommend to choose the subscription plan which covers your needs.
app.py
from flask import Flask, render_template
from api.financial_data import EODHDAPIsDataFetcher
from config import API_TOKEN

app = Flask(__name__)

data_fetcher = EODHDAPIsDataFetcher(API_TOKEN)

@app.route("/")
def exchanges():
    exchanges = data_fetcher.fetch_exchanges()
    return render_template("exchanges.html", exchanges=exchanges)

if __name__ == "__main__":
    app.run()
This is the entry point to our application and some initial code to get us started. You will see we import the API_TOKEN from config.py and pass it into the class called “EODHDAPIsDataFetcher“.
You will see the default route “/” E.g., “http://127.0.0.1:5000/” will retrieve a list of exchanges from the “data_fetcher“. The result returned from the function will be a JSON response.
The JSON response will be passed to an HTML template called “exchanges.html” and the exchanges information will be passed to the file as “exchanges“.
We will run it in the normal way:
% python3 app.pyThis will actually be extended to support configurable arguments as follows:
% python3 app.py --host 127.0.0.1 --port 5000 --debugWhen the web app is running we’ll be able to access it on: http://127.0.0.1:5000
templates/exchanges.html
<!DOCTYPE html>
<html lang="en">

<head>
    <meta charset="UTF-8">
    <meta name="viewport" content="width=device-width, initial-scale=1.0">
    <title>Exchanges</title>
</head>

<body>

{% for exchange in exchanges %}
    {{ exchange.Code }} <br />
{% endfor %}

</body>
</html>
This is not the finished file, but a minimal version of the file for illustration purposes. The main purpose of this file above is to show you how you import the “exchanges” variable array and loop through it. Each row will be returned as “exchange” and “Code” is a field on the row. You print a variable enclosed in double curly brackets. This structure can be replicated for all your API endpoints.
Later we’ll add a Bootstrap data table to this that will make the output look very nice.
api/financial_data.py
import json
from eodhd import APIClient


class EODHDAPIsDataFetcher:
    def __init__(self, api_token):
        self._api_token = api_token

    def fetch_exchanges(self):
        try:
            api = APIClient(self._api_token)
            df = api.get_exchanges()
            return json.loads(df.to_json(orient="records"))

        except Exception as e:
            print(f"Error fetching data: {e}")
            return None
When a user opens their browser and goes to, “http://127.0.0.1:5000” it will essentially direct you at the “/” route as described in “app.py“. You will see that the route calls “fetch_exchanges()“. This is where the API call will be made to the EODHD API’s Python library to retrieve the list of exchanges. The response from the Python library is returned as a Pandas dataframe. We want to convert this back to JSON to be returned back to the “exchanges.html” template.
Extending templates/exchanges.html
In the minimal code sample above I showed you how to display the data returned in an HTML format. It works, but doesn’t look very exciting without some styling. There is a really good Javascript library called Bootstrap that allows you to visualise tabulated data in a really nice way. It also has built in functionality to allow for page size, search, sort, pagination, and more natively.
<!DOCTYPE html>
<html lang="en">

<head>
    <meta charset="UTF-8">
    <meta name="viewport" content="width=device-width, initial-scale=1.0">
    <title>Exchanges</title>

    https://code.jquery.com/jquery-3.6.0.min.js

    https://cdn.datatables.net/1.11.5/js/jquery.dataTables.min.js
    <link rel="stylesheet" type="text/css" href="https://cdn.datatables.net/1.11.0/css/jquery.dataTables.min.css">

    <link href="https://cdn.jsdelivr.net/npm/bootstrap@5.1.0/dist/css/bootstrap.min.css" rel="stylesheet"
        integrity="sha384-KyZXEAg3QhqLMpG8r+8fhAXLRk2vvoC2f3B09zVXn8CA5QIVfZOJ3BCsw2P0p/We" crossorigin="anonymous">
    https://cdn.jsdelivr.net/npm/bootstrap@5.1.0/dist/js/bootstrap.bundle.min.js

    <script>
        $(document).ready(function() {
            $('#exchangesTable').DataTable();
        });
    </script>
</head>

<body>
    <div class="container">
        <h1>Exchanges</h1>
        <table id="exchangesTable" class="table table-sm table-light table-bordered table-hover table-striped">
            <thead>
                <tr>
                    <th>Name</th>
                    <th>Code</th>
                    <th>OperatingMIC</th>
                    <th>Currency</th>
                    <th>CountryISO2</th>
                    <th>CountryISO3</th>
                </tr>
            </thead>
            <tbody>
                {% for exchange in exchanges %}
                    <tr>
                        <td><a href="/exchange/{{ exchange.Code }}">{{ exchange.Name }}</a></td>
                        <td>{{ exchange.Code }}</td>
                        <td>{{ exchange.OperatingMIC }}</td>
                        <td>{{ exchange.Currency }}</td>
                        <td>{{ exchange.CountryISO2 }}</td>
                        <td>{{ exchange.CountryISO3 }}</td>
                    </tr>
                {% endfor %}
            </tbody>
        </table>
    </div>
</body>

</html>
In the above you will see that I imported the JQuery and Bootstrap libraries and stylesheets.
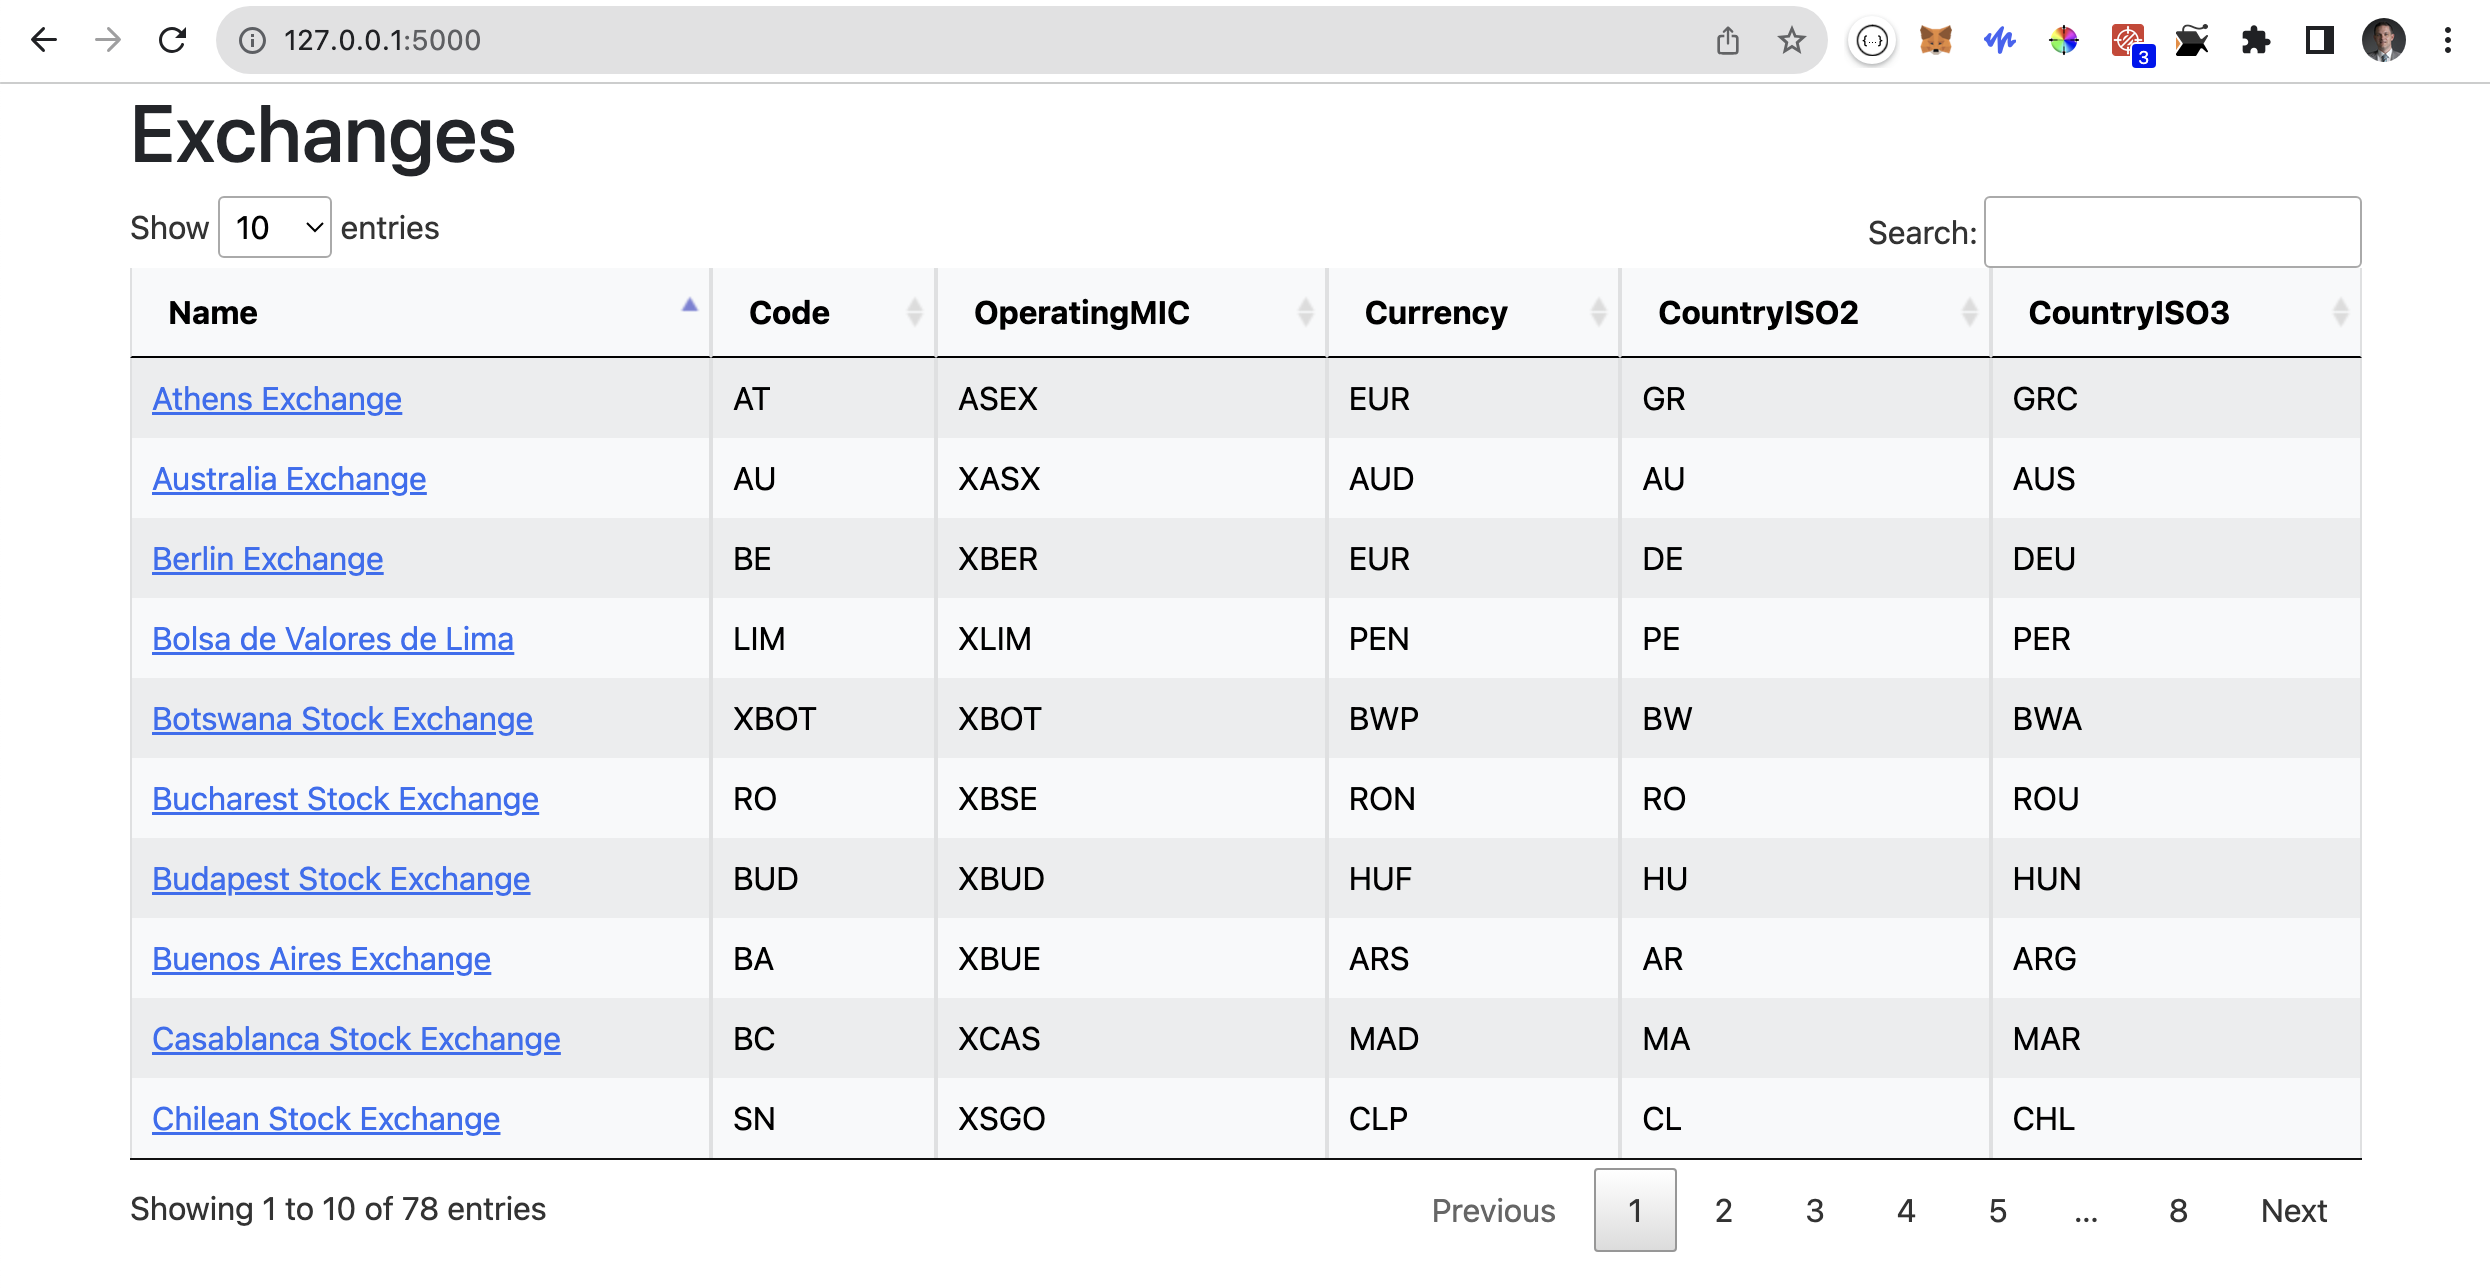
All this table functionality from page size, search, sorting, and pagination is all “out the box“.
Building on from here…
You will notice that in the “app.py” the Flask application starts like this, “app.run()“. This works but run() can take additional parameters like the IP to listen on, port to listen on, and if it runs in debug mode. Let’s add some command line arguments to improve this.
import re
import sys
import argparse
from flask import Flask, render_template
from api.financial_data import EODHDAPIsDataFetcher
from config import API_TOKEN


parser = argparse.ArgumentParser(description="EODHD APIs")
parser.add_argument(
    "--host",
    type=str,
    help="Web service IP (default: 127.0.0.1)",
)
parser.add_argument(
    "--port",
    type=int,
    help="Web service port (default: 5000)",
)
parser.add_argument("--debug", action="store_true", help="Enable debugging")
args = parser.parse_args()


# Listen on local host
http_host = "0.0.0.0"
if args.host is not None:
    p = re.compile(r"^\d{1,3}\.\d{1,3}\.\d{1,3}\.\d{1,3}$")
    if p.match(args.host):
        http_host = args.host
    else:
        parser.print_help(sys.stderr)

# Listen on local port
http_port = 5000
if args.port is not None:
    if args.port >= 0 and args.port <= 65535:
        http_port = args.port
    else:
        parser.print_help(sys.stderr)


app = Flask(__name__)

data_fetcher = EODHDAPIsDataFetcher(API_TOKEN)


@app.route("/")
def exchanges():
    exchanges = data_fetcher.fetch_exchanges()
    return render_template("exchanges.html", exchanges=exchanges)


if __name__ == "__main__":
    app.run(host=http_host, port=http_port, debug=args.debug)
What this will allow us to do is run the application like this:
% python3 app.py --host 127.0.0.1 --port 5000 --debugYou may also notice in the Exchanges screenshot above that there is a hyperlink against each exchange. For example, the top entry points to this, “http://127.0.0.1:5000/exchange/AT“.
The “/exchange/<code>” would be another route within Flask. The first step in adding a new route is to add it to the “app.py“.
@app.route("/exchange/<code>")
def exchange_markets(code):
    markets = data_fetcher.fetch_exchange_markets(code)
    return render_template("markets.html", code=code, markets=markets)
Some important points to note:
- The route has a configurable input that I called “<code>“. As you can see in the URL above “AT” is being passed as the “<code>“.
- “code” is then passed down to the function “exchange_markets(code)” which in turn passes the “code” down to “fetch_exchange_markets(code)“.
- You will also see that I’m passing a variables “code” and “markets” to the template, “markets.html“.
We will also need to add the corresponding fetch function to the “api/financial_data.py” file.
    def fetch_exchange_markets(self, code: str = ""):
        try:
            api = APIClient(self._api_token)
            df = api.get_exchange_symbols(code)
            return json.loads(df.to_json(orient="records"))

        except Exception as e:
            print(f"Error fetching data: {e}")
            return None
It looks almost identical to the previous function, but takes “code” as an input.
Finally, the “templates/markets.html” will look like this.
<!DOCTYPE html>
<html lang="en">

<head>
    <meta charset="UTF-8">
    <meta name="viewport" content="width=device-width, initial-scale=1.0">
    <title>markets</title>

    https://code.jquery.com/jquery-3.6.0.min.js

    https://cdn.datatables.net/1.11.5/js/jquery.dataTables.min.js
    <link rel="stylesheet" type="text/css" href="https://cdn.datatables.net/1.11.0/css/jquery.dataTables.min.css">

    <link href="https://cdn.jsdelivr.net/npm/bootstrap@5.1.0/dist/css/bootstrap.min.css" rel="stylesheet"
        integrity="sha384-KyZXEAg3QhqLMpG8r+8fhAXLRk2vvoC2f3B09zVXn8CA5QIVfZOJ3BCsw2P0p/We" crossorigin="anonymous">
    https://cdn.jsdelivr.net/npm/bootstrap@5.1.0/dist/js/bootstrap.bundle.min.js

    <script>
        $(document).ready(function() {
            $('#marketsTable').DataTable();
        });
    </script>
</head>

<body>
    <div class="container">
        <a href="/">Exchanges</a> > <b>{{ code }}</b>
        <p />

        <h1>{{ code }}</h1>
        <table id="marketsTable" class="table table-sm table-light table-bordered table-hover table-striped">
            <thead>
                <tr>

                    <th>Code</th>
                    <th>Name</th>
                    <th>Country</th>
                    <th>Exchange</th>
                    <th>Currency</th>
                    <th>Type</th>
                    <th>Isin</th>
                </tr>
            </thead>
            <tbody>
                {% for item in markets %}
                    <tr>
                        <td><a href="/exchange/CC/{{ item.Code }}/1h">{{ item.Code }}</a></td>
                        <td>{{ item.Name }}</td>
                        <td>{{ item.Country }}</td>
                        <td>{{ item.Exchange }}</td>
                        <td>{{ item.Currency }}</td>
                        <td>{{ item.Type }}</td>
                        <td>{{ item.Isin }}</td>
                    </tr>
                {% endfor %}
            </tbody>
        </table>
    </div>
</body>

</html>
Once again, it has an almost identical structure to the “exchanges.html” file.
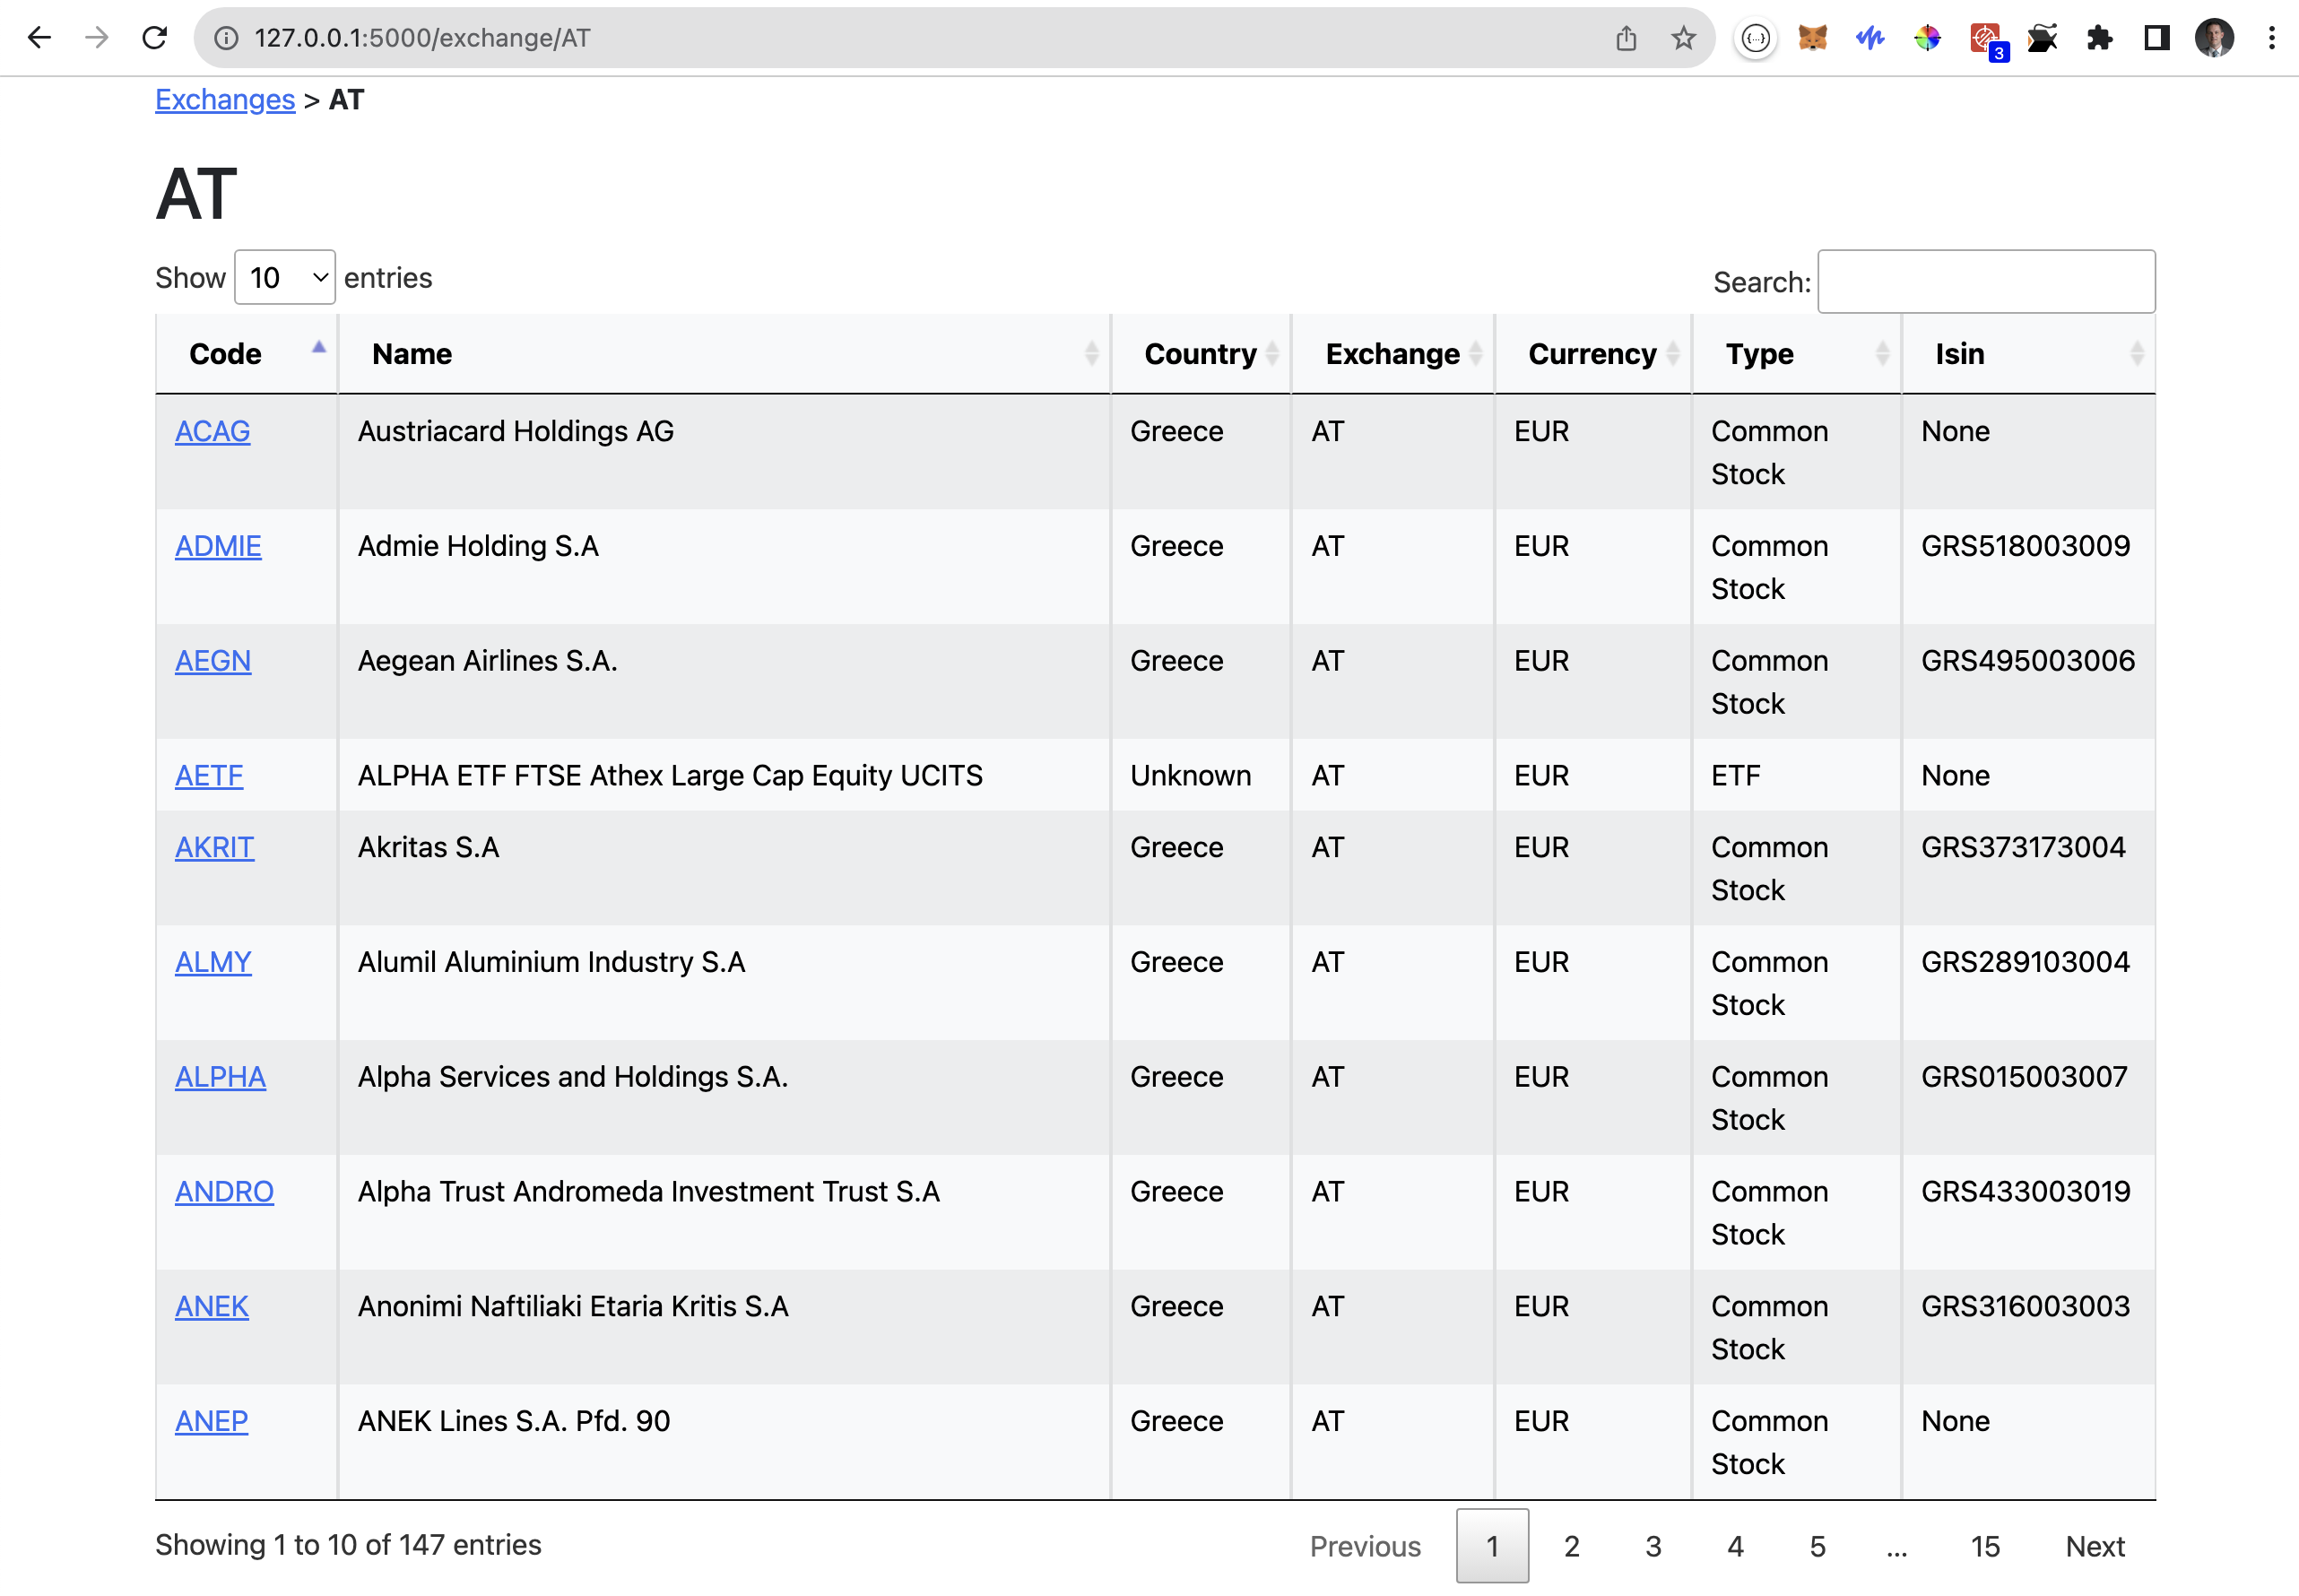
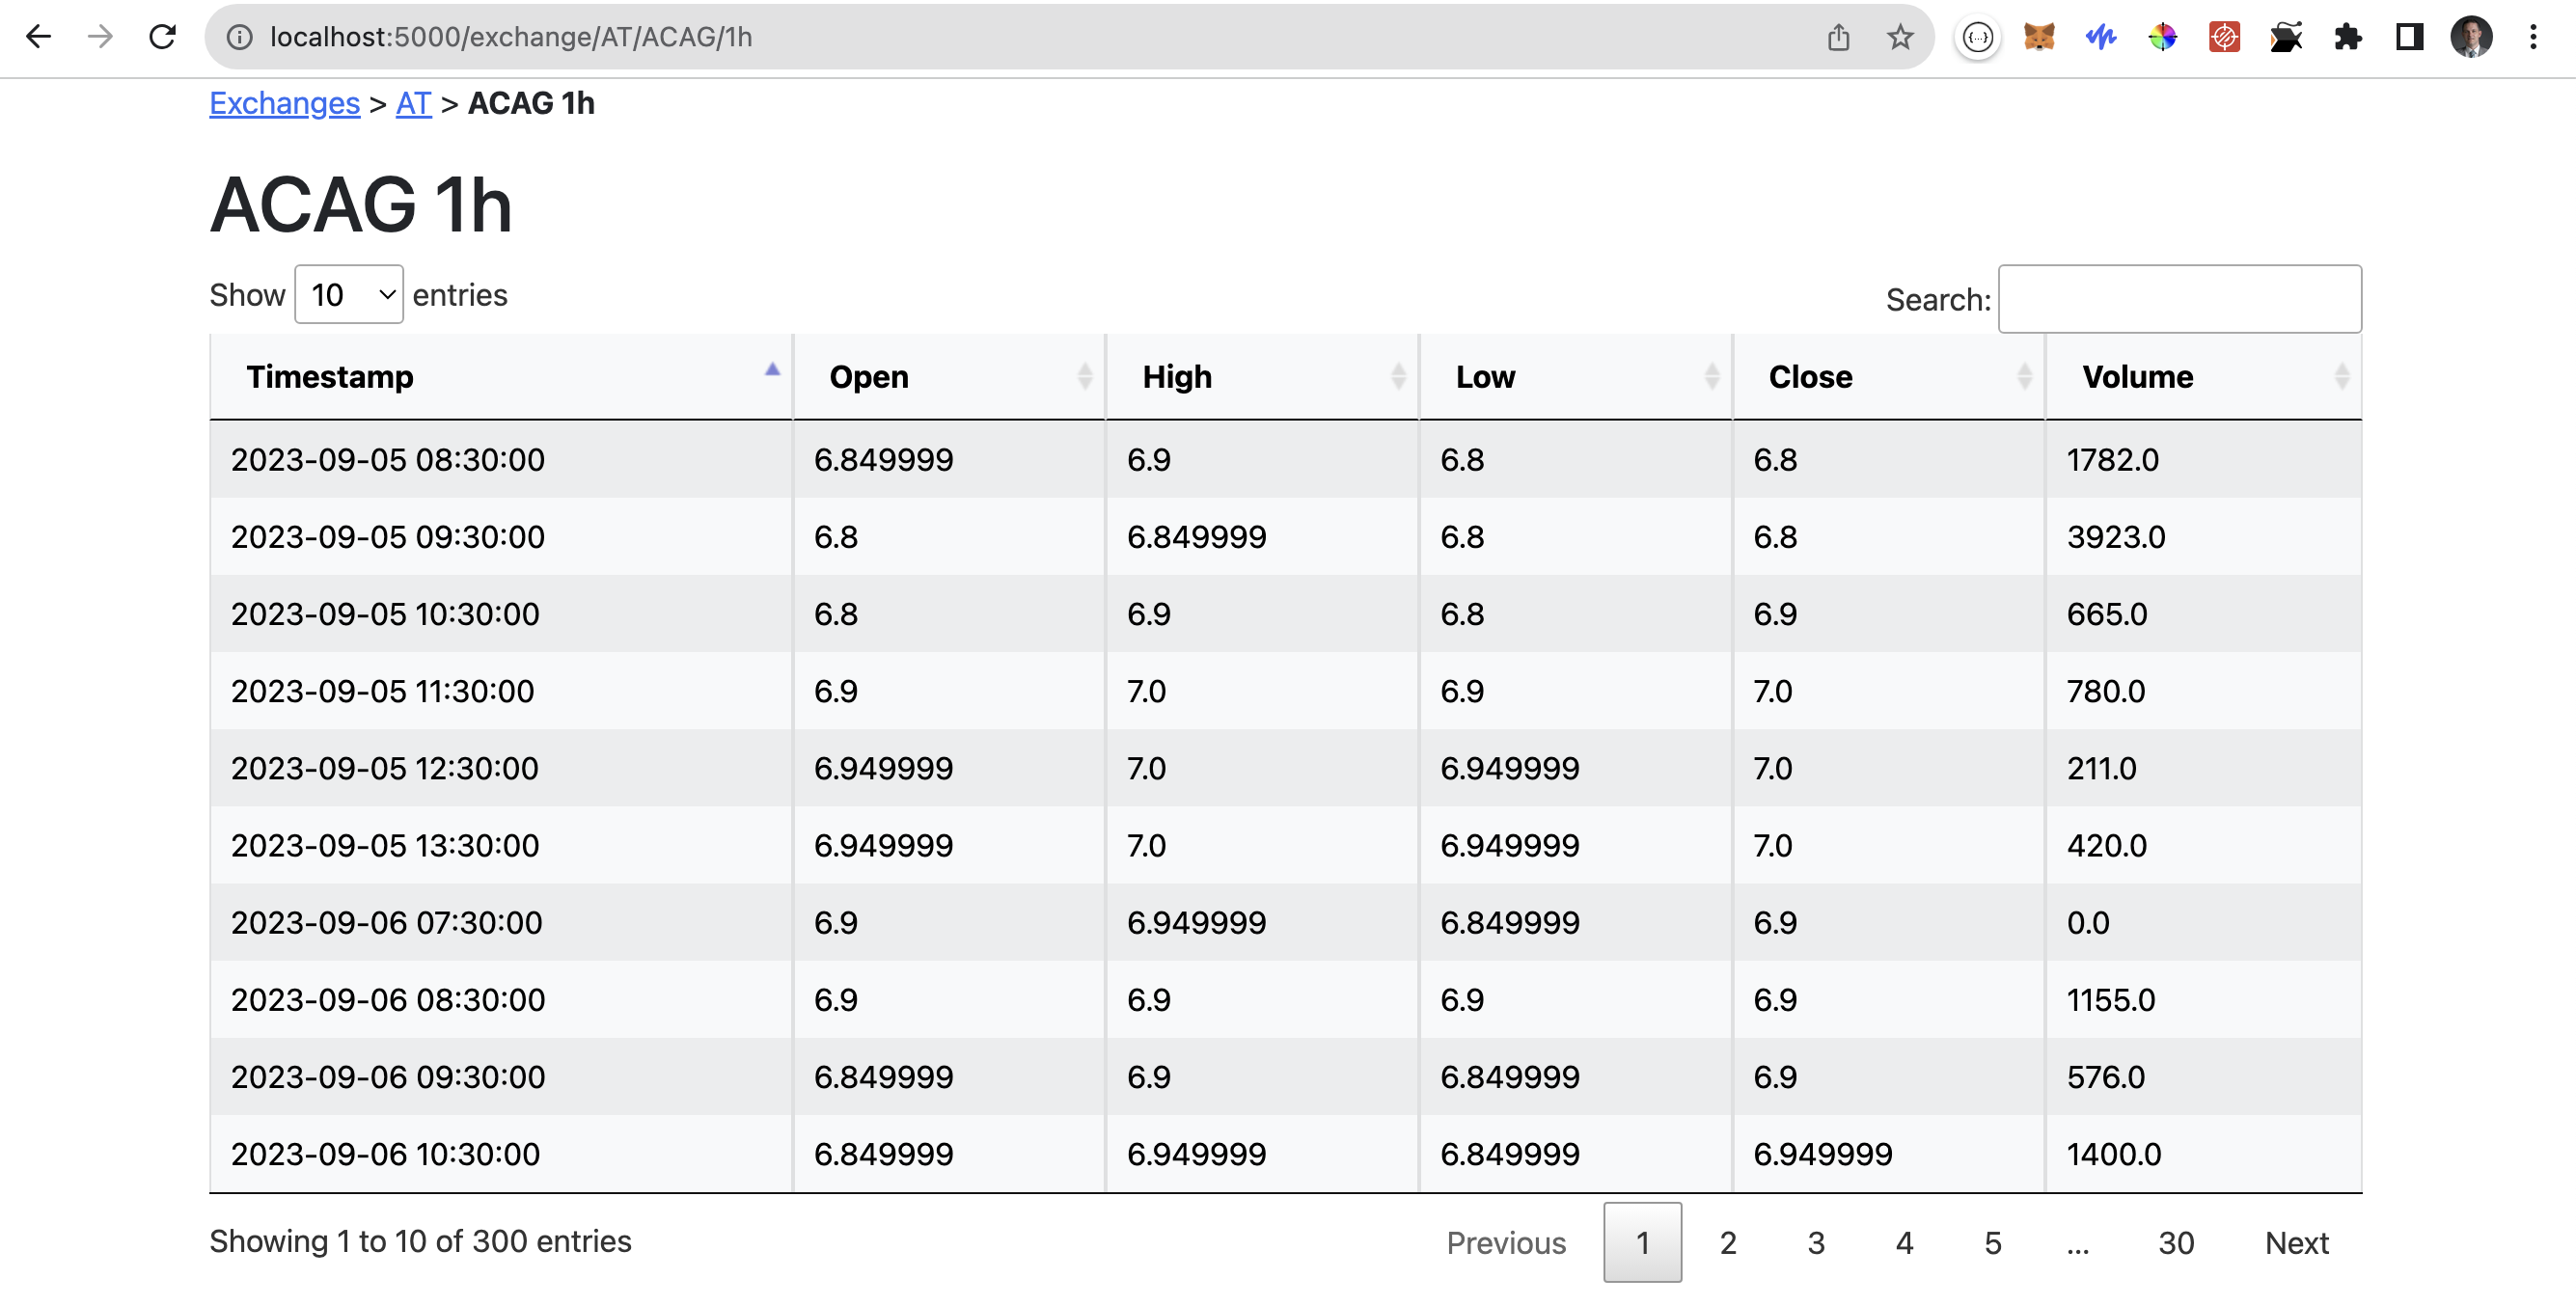
As you can see we have now drilled down into the “Athens Exchange (AT)” and viewing the markets. You will notice there are breadcrumbs at the top to be able to jump back to the exchange list easily. You are also able to drill down further into “Austriacard Holdings AG (ACAG)” market to view the hourly candlestick data.
Conclusion
And there you have it, a functional web application written in Python using Flask to browse EODHD APIs data in your browser. Although a solid, start this is only the beginning of your journey. We currently have the web application running in a development environment. This should be running on a production WSGI server instead E.g. the mod_wsgi in Apache 2.4.
The candlestick data is currently showing hourly data only. It could be further enhanced to support the other supported intervals as well. Maybe including buttons on the market list page to drill down into an interval specifically.
The data is currently displaying the raw API data. It could be further enhanced to include technical indicators E.g., trend indicators, momentum indicators, volume indicators, volatility indicators, and more.
You would also add some graphs to enhance the aesthetic appeal of the web application. Maybe use a graphing library like D3.js.
You can find the complete solution in my Github repo.