
In today’s dynamic financial landscape, effective portfolio risk management is paramount for investors seeking to protect their wealth and optimize returns. By leveraging the power of Excel and EODHD’s APIs, investors can streamline the process of monitoring and managing portfolio risk.
Excel, a versatile spreadsheet application, provides a robust platform for analyzing and visualizing financial data. When combined with EODHD’s APIs, which offer access to historical and real-time market data, investors can create powerful risk management tools. The article will guide you through the steps necessary to create your own risk analysis dashboard.
You can also check our guides for How to Create Google Sheets Portfolio Tracker and EODHD Google Sheets Add-in. Here you’ll find more information on our Ready-to-Go solutions.
Download our Risk Portfolio Tool Template to follow the article:
Quick jump:
Portfolio Risk Management
Monitoring the risk of a portfolio is a crucial aspect of investment management. By keeping a close eye on potential risks, investors can make informed decisions and adjust their strategies accordingly. Here are some key steps to effectively monitor the risk of your portfolio:
- Understand your risk tolerance: Before you start monitoring your portfolio’s risk, it’s essential to determine your personal risk tolerance. Consider factors such as your investment goals, time horizon, and financial stability.
- Diversify your portfolio: Diversification is a fundamental risk management technique. By spreading your investments across various asset classes, sectors, and geographical regions, you can minimize the impact of any single investment’s performance on your overall portfolio.
- Monitor market conditions: Keep track of market trends, economic indicators, and geopolitical events that may affect your investments. This will help you anticipate potential risks and make necessary adjustments to your portfolio.
- Use risk metrics: Employ risk metrics such as beta, standard deviation, and Sharpe ratio to quantify the risk associated with your investments. These metrics can help you compare the risk-adjusted returns of different assets and make informed decisions.
- Monitor individual investments: Keep an eye on the performance of individual investments within your portfolio. If a particular investment consistently underperforms or exhibits increased risk, consider replacing it with a more suitable alternative.
Connect EODHD APIs to Excel
Using the EODHD API requires registering for an API key. However, you can follow along with this article using the ‘demo’ key for the tickers AAPL, MSFT, TSLA, and MCD.
To obtain an API Key please visit the EODHD website (https://eodhd.com/) and sign up for an account. Navigate to the API section and generate an API key. Make sure to keep this key secure, as it will be used to authenticate your API requests.
To import data from the EODHD API into Excel, we’ll use the WEBSERVICE function. This allows fetching data from a URL directly into cells.
In a new Excel spreadsheet, enter the following formula to pull in the list of supported stock exchanges:
=WEBSERVICE("https://eodhd.com/api/exchanges-list/?api_token=YOUR_API_KEY&fmt=json")
Replace YOUR_API_KEY with your EODHD API key. This will populate the sheet with a JSON array of the exchange data. You can change “&fmt=json” to “&fmt=csv” to get the data in CSV format instead.
WEBSERVICE function loads all the data in one cell, for one value this function would be sufficient. However, for a list of values, it’s better to transform the data using TEXTSPLIT and TRANSPOSE functions. An example of the cell formula is the following:
=TEXTSPLIT(WEBSERVICE("https://eodhd.com/api/exchanges-list/?api_token=YOUR_API_KEY&fmt=json"),":",",")
In case your version of Excel does not support the TEXTSPLIT Excel function you can use a workaround utilizing the FILTERXML function. To use the FILTERXML function please format JSON output using MID and SUBSTITUTE cell formulas. The result cell formula will look like this:
=LET(raw_data, WEBSERVICE("https://eodhd.com/api/exchanges-list/?api_token=YOUR_API_KEY&fmt=json"), FILTERXML("<t><s>"&SUBSTITUTE(MID(raw_data,2,LEN(raw_data)-2),",","</s><s>")&"</s></t>","//s") )
The function will return raws with the data from the JSON request.
Similar to get the stock ticker list for a specific exchange, like the US market (code “US”):
=WEBSERVICE("https://eodhd.com/api/exchange-symbol-list/US?api_token=YOUR_API_KEY&fmt=json")
This returns all active US stocks and ETFs in JSON format.
Importing Historical EOD Data
Create a separate sheet for the historical data required for the ratios’ calculations. Use the TRANSPOSE function to transform your vertical list of tickers into a horizontal:
=TRANSPOSE(tickers_list)
To import historical end-of-day price data for a stock, use this formula:
=LET(raw_data, WEBSERVICE("https://eodhd.com/api/eod/AAPL.US?api_token=YOUR_API_TOKEN&fmt=json&filter=adjusted_close&from=2024-01-01"), FILTERXML("<t><s>"&SUBSTITUTE(MID(raw_data,2,LEN(raw_data)-2),",","</s><s>")&"</s></t>","//s") )
Adjust the ticker symbol, date range, and API key as needed. This pulls in the daily OHLCV data for Apple from the specified date.
Portfolio Volatility
Volatility is a statistical measure of the dispersion of returns for a given security or market index. In most cases, the higher the volatility, the riskier the security. Volatility is often measured from either the standard deviation or variance between returns from that same security or market index.
Portfolio Volatility = sqrt(Σ(w_i * (σ_i * sqrt(T))))
where:
- w_i is the weight (proportion) of component i in the portfolio
- σ_i is the volatility (standard deviation) of component I
- T is the number of periods in the time horizon (e.g., 252 trading days)
Excel formula for portfolio volatility:
=STDEV($B$4:$B$68)/SQRT(COUNT($B$4:$B$68))
Where $B$4:$B$68 range of historical daily price change. To calculate daily price change add new column and drag the formula:
=(current_price-previous_price)/privious_price
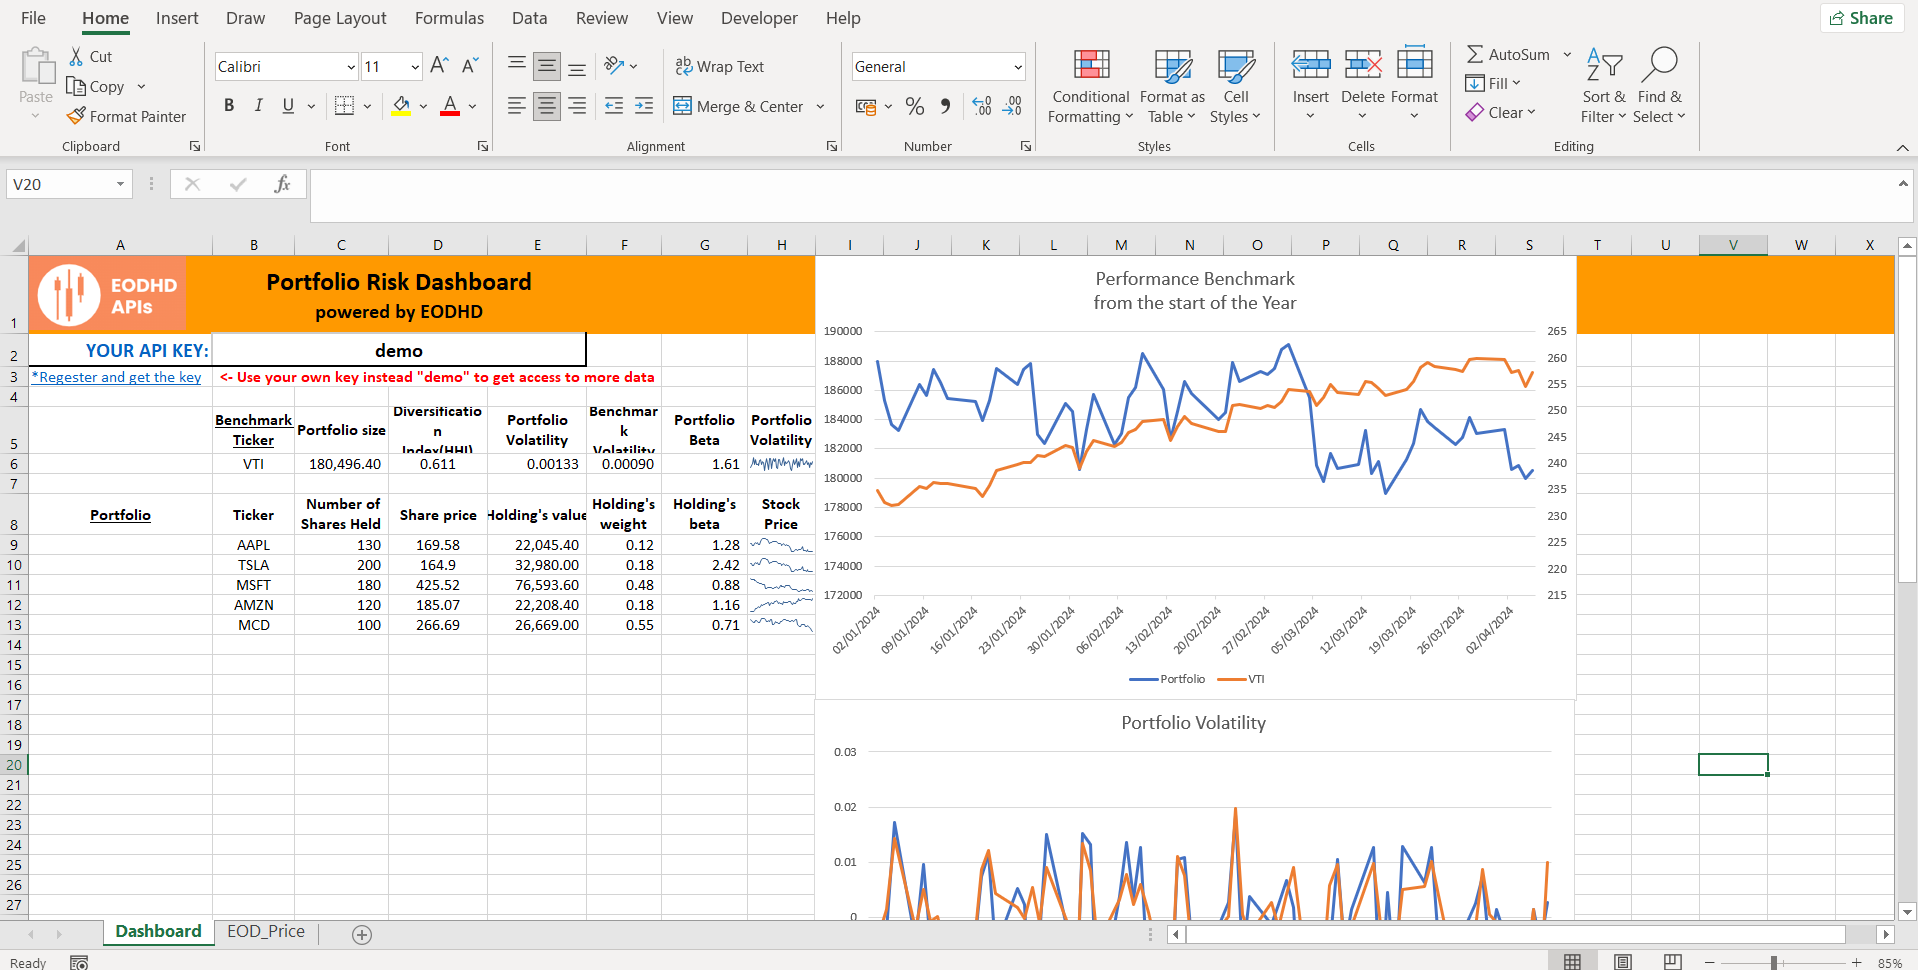
To better visualize volatility you can compare price changes with the benchmark. In the example template, you will find the benchmark VTI ETF. VTI ETF performance tracks the US market changes and a good indicator for comparison. To compare the performance of the portfolio and VTI ETF insert the line chart and select historical price and date data.
Components Beta
Beta (β) is a measure of the volatility—or systematic risk—of a security or portfolio compared to the market as a whole (usually the S&P 500). Stocks with betas higher than 1.0 can be interpreted as more volatile than the S&P 500.
You can get beta using our Fundamental or Technical APIs. Fundamental API shows current beta while technical could be used for historical Beta values. An example of the API call using WEBSERVICE function:
=VALUE(WEBSERVICE("https://eodhd.com/api/fundamentals/AAPL.US?api_token=YOUR_API_TOKEN&fmt=json&filter=Technicals::Beta"))
Cell function pulls up JSON data for the current value of beta, and formats using the VALUE function into the float number.
To get a portfolio β we could use a weighted sum of portfolio components’ betas:
=SUMPRODUCT(F9:F13,G9:G13)/COUNT(G9:G13)
Where: F9:F13 range of weights, G9:G13 range of component’s betas.
Portfolio Diversification Index (HHI)
The Herfindahl index is a measure of the size of firms in relation to the industry they are in and is an indicator of the amount of competition among them.
The Excel formula for HHI is the following:
=SUMPRODUCT(F9:F13^2)
Where F9:F13 range of portfolio component weights. The index will help you to balance your portfolio.
Visualization
Design a user-friendly dashboard in Excel to visualize your portfolio’s risk profile. Use charts, graphs, and tables to display risk metrics, asset allocations, and performance data. This dashboard will provide a clear overview of your portfolio’s risk exposure.
To insert charts go to insert->chart menu. Select the data range, and choose the type and style of your chart. Use sparkling in-cell charts to visualize individual dynamic historical data. An example of the visualization can be found in Our template.
Conclusion
Excel and EODHD’s APIs provide investors with a powerful toolkit for portfolio risk management. By harnessing the capabilities of these tools, investors can gain deeper insights into their portfolio’s risk profile, make informed decisions, and ultimately work towards achieving their financial goals.
Sign up for an EODHD API key to get started building your own best Excel risk management dashboard. Feel free to contact our support team at support@eodhistoricaldata.com for any questions or current discount offers. We’re happy to assist you through the process of leveraging EODHD’s data to elevate your investment workflow.
Join the discussion at forum.eodhd.com