
Analyzing a company’s financial statements is essential for investors and finance professionals to assess corporate performance and health. While this process can be complex, Financial Statement Analysis in Excel powered by dynamic EODHD APIs is much more efficient.
In this guide, we’ll walk through how to build an Excel template that pulls key financial statement data from EODHD’s APIs, allowing you to analyze any public company’s financials. EODHD provides simple JSON APIs covering fundamentals, stock prices, and more for 150,000+ tickers across 70+ worldwide exchanges.
You can also check our guides for Excel Stock Portfolio Tracker and Market Dashboard. Here you’ll find more information on our Ready-to-Go solutions.
Download our Financial Analysis Excel Template to follow the article:
Quick jump:
Sign up for EODHD and get your API key
Register for a free EODHD account at https://eodhd.com/register to receive your API key. The free plan allows 20 API requests/day and 1 year of EOD historical data. Paid plans starting at $19.99/month enable more API calls and access to 30+ years of data.
To follow the article and test the basic functionality of our APIs you can use our “demo” key. The key gives you access to the Fundamentals and Historical data for AAPL, TSLA, MSFT, and MCD tickers.
Create a Spreadsheet
You can download our template spreadsheet to be able to recreate steps more easily. However, you could create your own spreadsheet following the next steps:
- Add rows for the main line items like revenue, net income, assets, liabilities, etc.
- Use Excel formulas to calculate metrics like Revenue Growth %, Profit Margin, ROE, etc.
- Create sections for the three key statements: Income Statement, Balance Sheet, Cash Flow
To navigate statements, you can use the dropdown list option. Navigate to “Data->Data Tools->Data Validation” and allow list option.
Pull in data from EODHD API
The main tool to retrieve data into the spreadsheet cell from an API is a “=WEBSERVICE()” Excel formula. By using the formula you can get access to all our Fundamental And Historical APIs. Thus, It is important to check the official documentation from Microsoft.
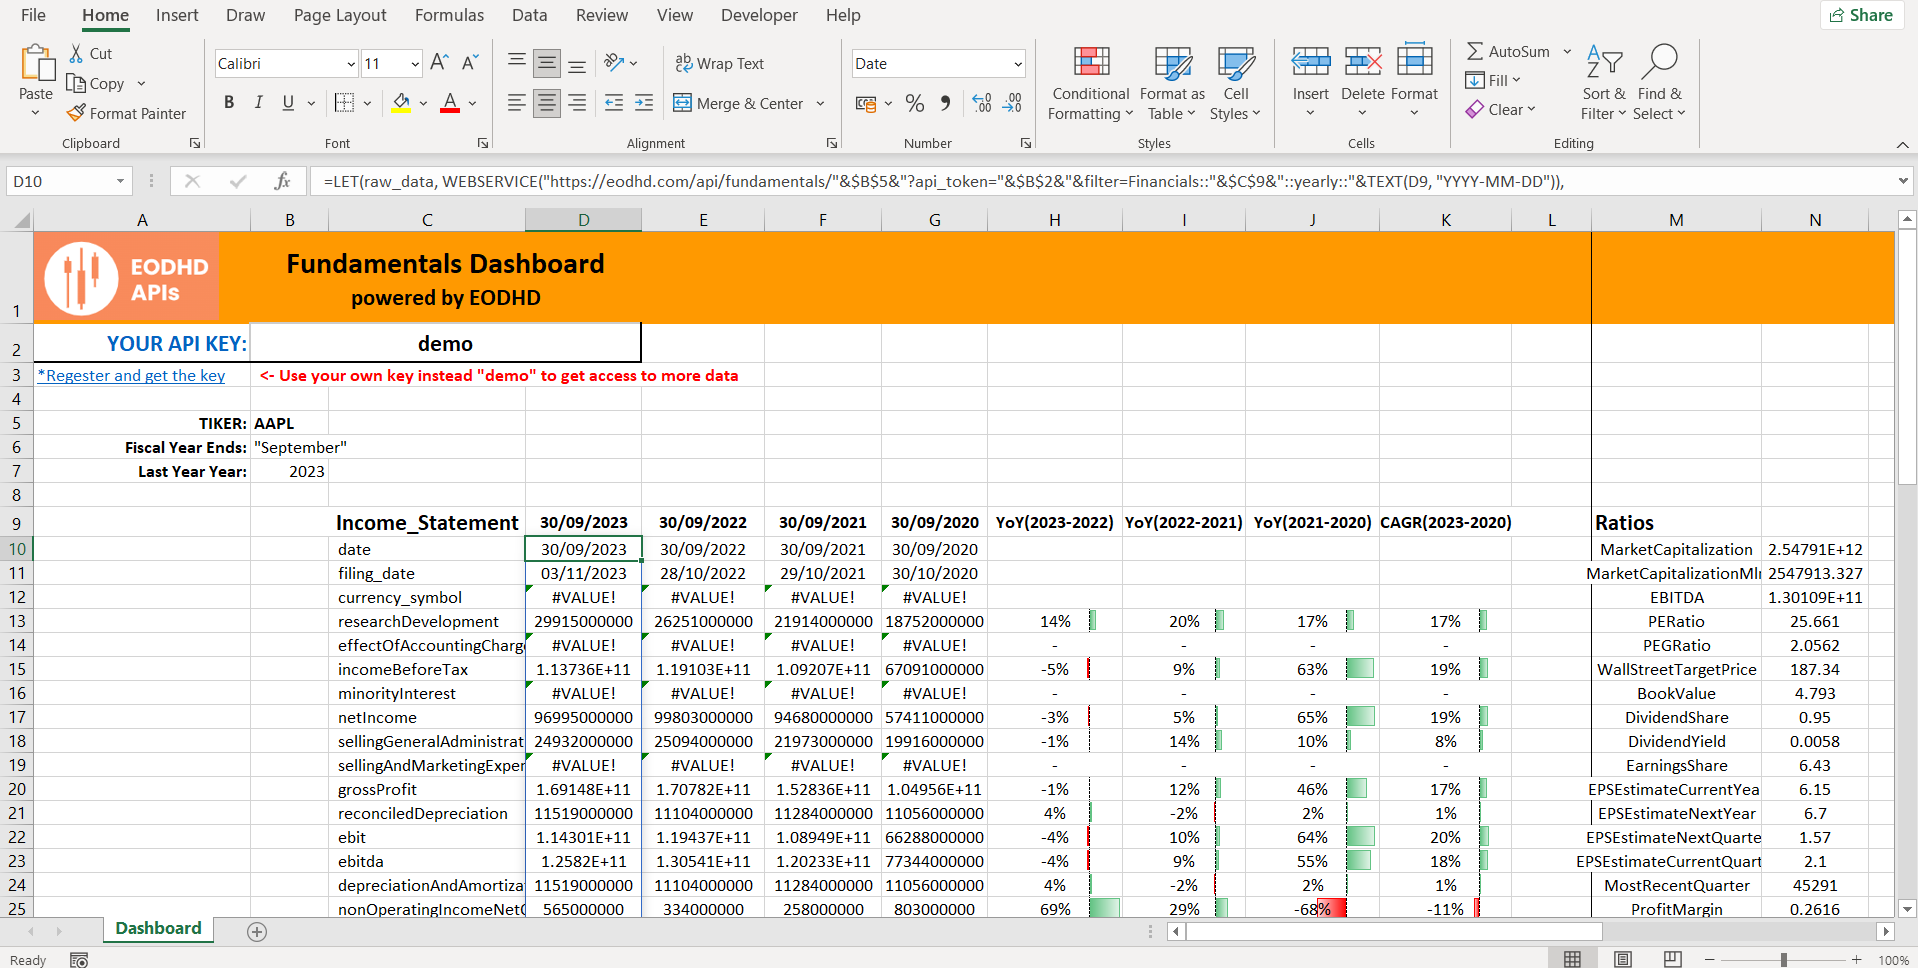
Use the Fundamentals API to retrieve the financial statement figures for your chosen stock:
=LET(raw_data, WEBSERVICE("https://eodhd.com/api/fundamentals/"&$B$5&"?api_token="&$B$2&"&filter=Financials::"&$C$9&"::yearly::"&TEXT(D9, "YYYY-MM-DD")),
filtered_data, FILTERXML("<t><s>"&SUBSTITUTE(MID(raw_data,2,LEN(raw_data)-2),",","</s><s>")&"</s></t>","//s"),
VALUE(SUBSTITUTE(SUBSTITUTE(filtered_data, LEFT(filtered_data, FIND(":", filtered_data)), ""), """", "")))
How the formula works:
- It retrieves data from a web service using the WEBSERVICE function, with the URL constructed using cell references $B$5(ticker) and $B$2(API token).
- After that, the raw data from the web service is stored in the variable ‘raw_data’.
- The FILTERXML function allows parsing the ‘raw_data’ by converting commas to XML tags, creating an XML structure, and then extracting the desired data using an XPath expression. The result is stored in the ‘filtered_data’ variable.
- The LEFT and FIND functions locate and remove a specific substring (from the start of the string until the first colon) from the ‘filtered_data’.
- The SUBSTITUTE function replaces the identified substring with an empty string.
- Finally, the VALUE function converts the resulting string to a numeric value.
Add Ratios
There are several ways to calculate ratios or metrics to show the trend in financials over the period.
Year-over-Year (YoY) Growth Rate: Calculate the percentage change in earnings from one year to the next. For example:
2023 vs 2022: (27195000000 - 24512000000) / 24512000000 = 10.95%
Then duplicate the formula over the number of periods required. The template has 4 years, you can monitor the change over longer periods depending on your analysis time horizon.
Compound Annual Growth Rate (CAGR): Calculate the average annual growth rate over the entire period. For example:
CAGR = (Ending Value / Beginning Value)^(1 / Number of Years) - 1 CAGR = (27195000000 / 19269000000)^(1 / 3) - 1 = 12.19%
These ratios help demonstrate the trend in financials over the period. The YoY Growth Rate shows the year-to-year changes, the CAGR represents the average annual growth rate.
To pull in the current recalculated ratios, use the following cell formula with the Fundamental API call:
=LET(raw_data,WEBSERVICE("https://eodhd.com/api/fundamentals/"&$B$5&"?api_token="&$B$2&"&filter=Highlights"),
filtered_data,FILTERXML("<t><s>"&SUBSTITUTE(MID(raw_data,2,LEN(raw_data)-2),",","</s><s>")&"</s></t>","//s"),
SUBSTITUTE(LEFT(filtered_data,FIND(":",filtered_data)-1),"""",""))
The formula retrieves data from an API call, extracts a specific portion of the response using string manipulation and XML parsing, and returns a list of numeric values.
Add conditional formatting and charts
Use conditional formatting to highlight trends like falling revenue. Create charts showing the growth rates of key metrics over time.
To visualize changes in the Financials, you could use conditional formatting on calculated ratios. This will visualize changes over the period for a specific value. Select an array of values and choose Home-Conditional Formating-Data Bars.
Conclusion
With this template powered by EODHD’s APIs, you can quickly access and analyze the financials for any stock to uncover crucial insights. The EODHD platform offers:
- Worldwide coverage: 150,000+ stocks, 20,000+ ETFs, 1000+ indices across 70+ exchanges
- Deep history: 30+ years of fundamentals and EOD pricing data
- Excel-friendly: Simple APIs that work seamlessly with WEBSERVICE
- Low cost: Plans from $19.99/month
EODHD’s financial data APIs combined with Excel’s analysis capabilities provide a powerful yet accessible toolset for in-depth financial statement analysis. This templated approach streamlines the data gathering to let you focus on uncovering actionable insights to drive better investment decisions.
Feel free to contact our support team at support@eodhistoricaldata.com for any questions or current discount offers. We’re happy to assist you through the process of leveraging EODHD’s data to elevate your investment workflow.