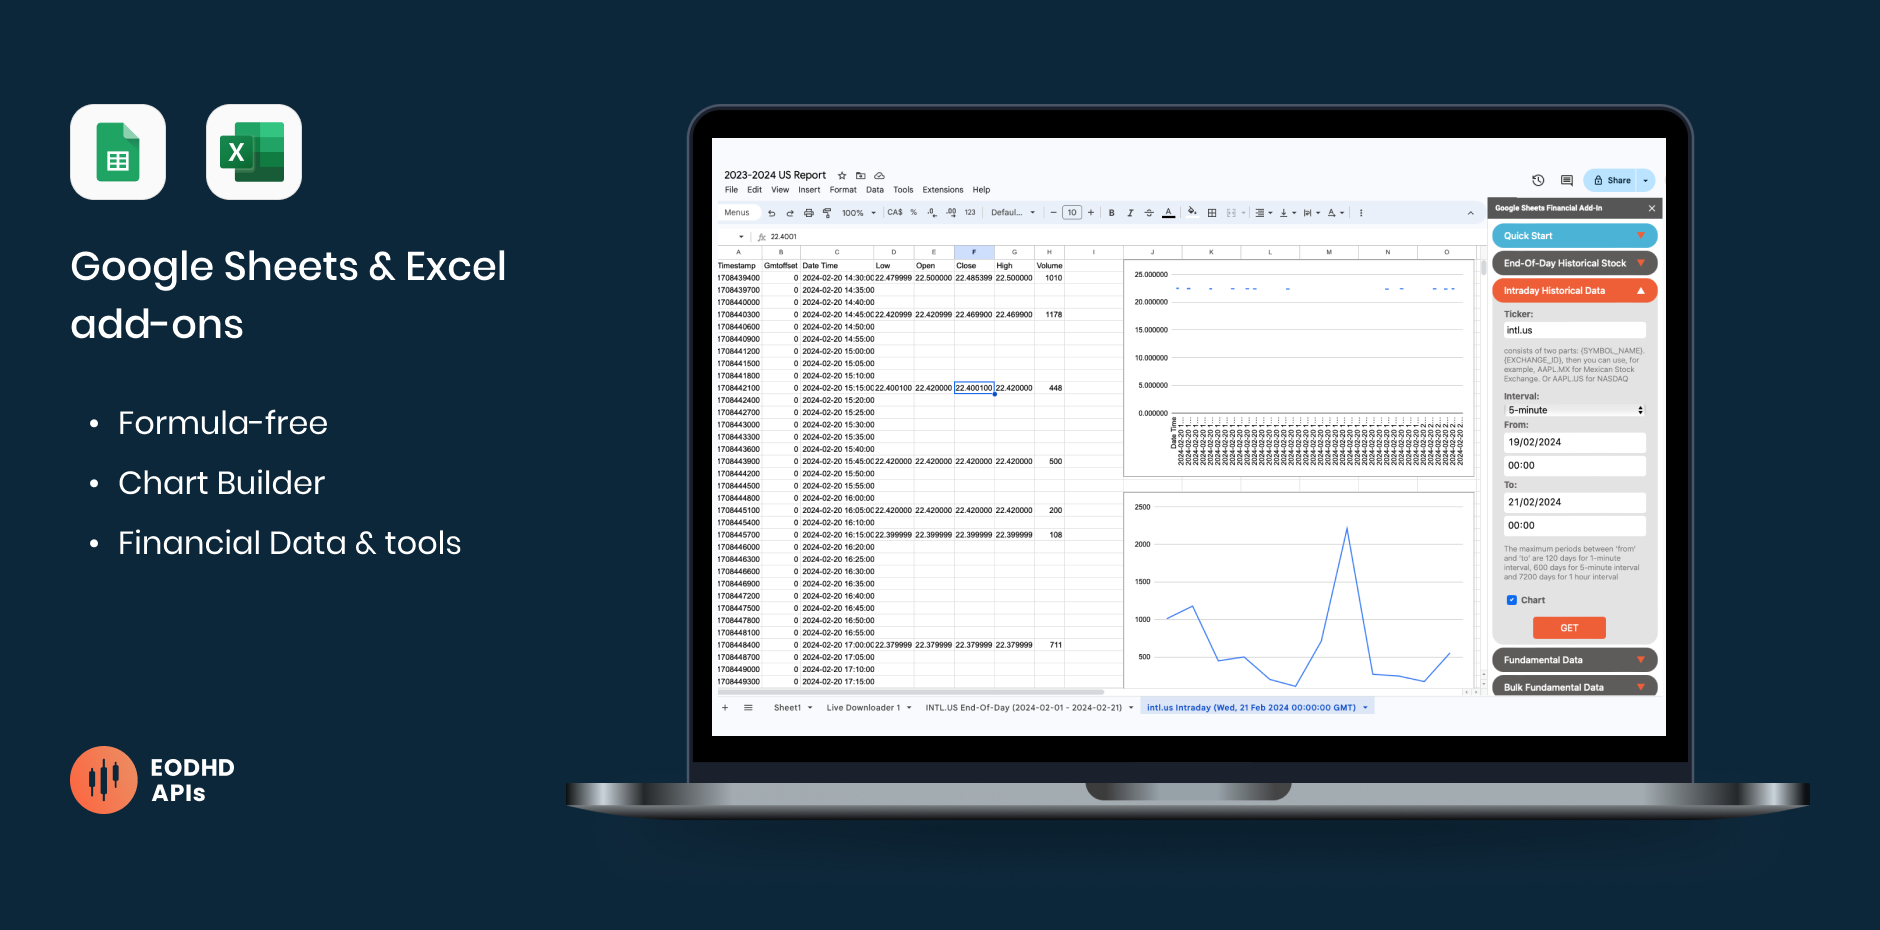
If you are not familiar with programming languages, one of the best ways to retrieve stock price in Excel and Google Sheets (or any other financial data) is our Excel and Google Sheets add-ons. Without any complicated code, you can easily get:
• Fundamental data for Stocks, ETF or Funds
• End-of-day historical data
• Intraday data
Quick jump:
- 1 What is stock market data, and why do you need it?
- 2 Different types of stock market data
- 3 Getting stock market data using a web platform
- 4 Getting stock market data using an API
- 5 Getting stock market data in Excel or Google Sheets
- 6 How to choose the best stock market data provider method
- 7 Video tutorial for EODHD Excel add-on: Installation and examples
- 8 Activate your API key
- 9 Examples of Excel add-on features
- 10 Excel VBA example
- 11 Excel VBA script for multiple (bulk) downloads
- 12 LIVE API Excel Webservice support
What is stock market data, and why do you need it?
Understanding stock market data is crucial for making informed investment decisions, eather you are implementing data to your coding project or using it in Excel and Google Sheets analysis. It provides insights into the performance of various assets, including stocks, indices, and currencies. With access to reliable financial data, investors can analyze market trends, identify opportunities, and mitigate risks effectively. Our Financial Data API offers a seamless way to access high quality market data, empowering users to make informed decisions and stay ahead in the competitive financial landscape.
Different types of stock market data
Stock market data, comprising Historical, Real-time, Intraday, and End of Day (EOD) data, is pivotal for investors & data analysts. Fundamental data reveals company financials, and alternative sources offer insights into market sentiment. Intraday data sheds light on price fluctuations during the trading day, while EOD data summarizes market activity at the close. Historical data provides insights into past market trends, while real-time data offers up-to-the-minute information crucial for timely decision-making. Plus to the data our API also offers useful tools such as Screener & Technical Indicators.
Getting stock market data using a web platform
Considered to be the least convenient method, obtaining stock market data through a web platform or an application involves navigating to the platform, specifying desired criteria such as date ranges and asset classes, and then accessing the data either through downloadable files or interactive charts and tables. As the market constantly evolves and data changes, it becomes very hard to track data updates.
Getting stock market data using an API
Utilizing an API straight away makes a developer’s life much easier, as from now on, the API provider is responsible for adapting to any data updates. To access stock market data, it entails integrating the API into your software environment, sending requests to the API specifying the required data parameters, and receiving the requested data in a structured format such as JSON or CSV files.
Getting stock market data in Excel or Google Sheets
A logical alternative to working with APIs, especially if you lack coding skills, is to implement financial data directly into Excel or Google Sheets. We provide both add-ons that retrieve the data, build charts, and don’t even require the use of formulas – all requests can be done in just a few clicks.
How to choose the best stock market data provider method
As there are various data providers in the market offering data via API, pay attention not only to pricing but also to the quality of data, the professionalism of the support team, and the convenience of Excel, Google Sheets, and other add-ons if they are offered. When choosing an Excel add-on, it’s important to understand if the app has a user-friendly interface, requires knowledge of writing Excel formulas, automatically builds charts, and which data can be accessed. The data we offer:

EODHD Excel add-on is formula-free, constantly updates, and has a 24/7 support team behind it. Download the Excel add-on and see the full list of its features here.
Also, if you are former Yahoo user, you can check our article on How to Migrate from Yahoo Finance API.
Video tutorial for EODHD Excel add-on: Installation and examples
Watch the video where Jonathon shows you how to use the EODHD Financial Excel add-on. Or scroll down to read more about the add-on.
Activate your API key
In order to use EODHD Excel Add-on it’s necessary to register on our site. Registration is free and provides you API Key which should be used in Excel Add-on in order to get access to data. We offer free financial API for Excel and payed plans which include different types of data.
1. You can start with “DEMO” API key to test the data for a few tickers only: AAPL.US, TSLA.US , VTI.US, AMZN.US, BTC-USD and EUR-USD. For these tickers, all of our types of data (APIs), including Real-Time Data, are available without limitations.
2. Register for the free plan to receive your API key (limited to 20 API calls per day) with access to End-Of-Day Historical Stock Market Data API for any ticker, but within the past year only. Plus a List of tickers per Exchange is available.
3. We recommend to explore our plans, starting from $19.99, to access the necessary type of data without limitations.
Once you have an API key and Excel add-on is installed, you are ready to use it:

Examples of Excel add-on features
All company tickers are connected to our database, so you won’t need to guess; you can easily search for them:

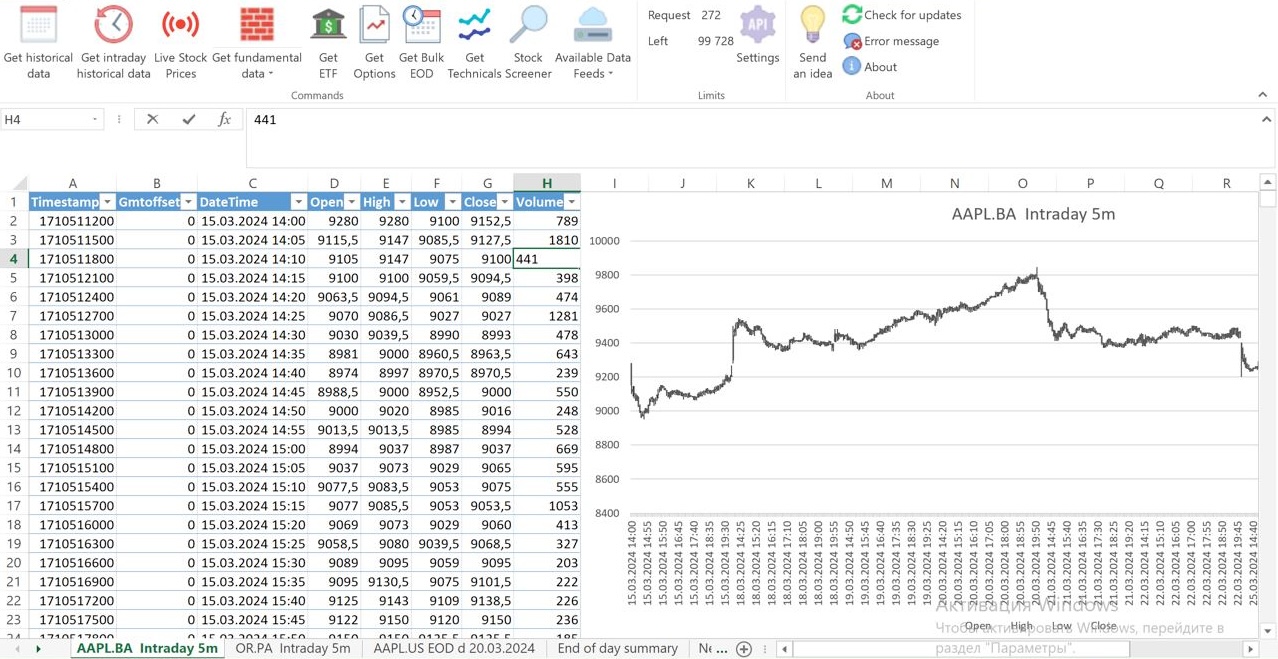
All possible type of data requests are listed above the spreadsheet. An example for intraday request with chart:
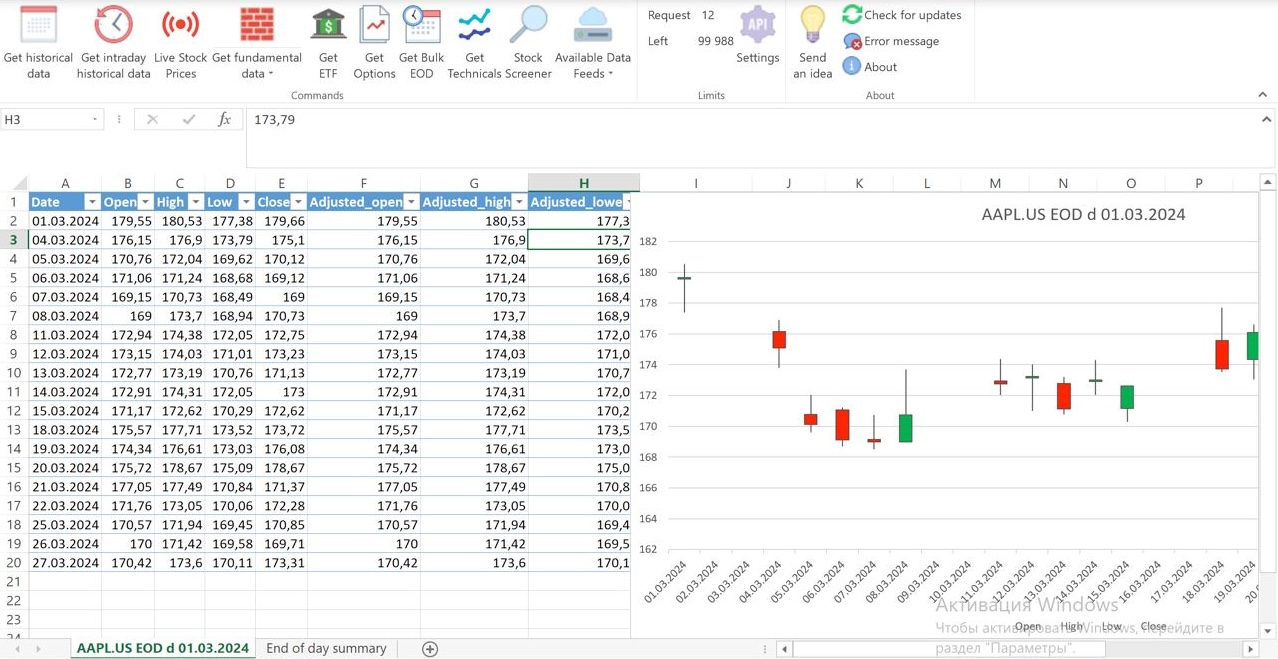
A result of Historical data request with candlestick chart:
Excel VBA example
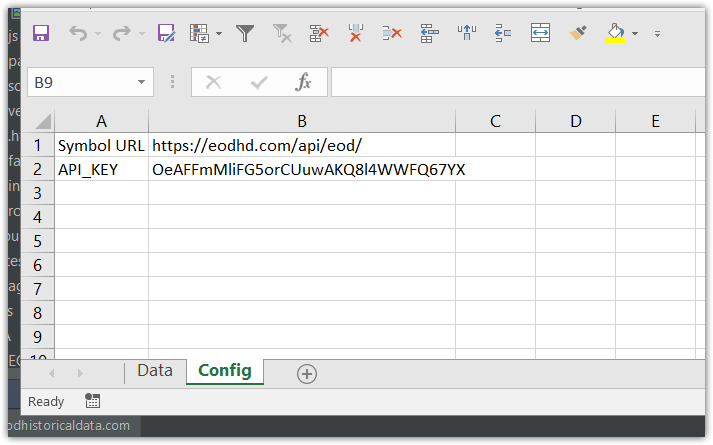
We created an Excel VBA example that works with our API. You can download an example of XLS-file and read our instructions below.
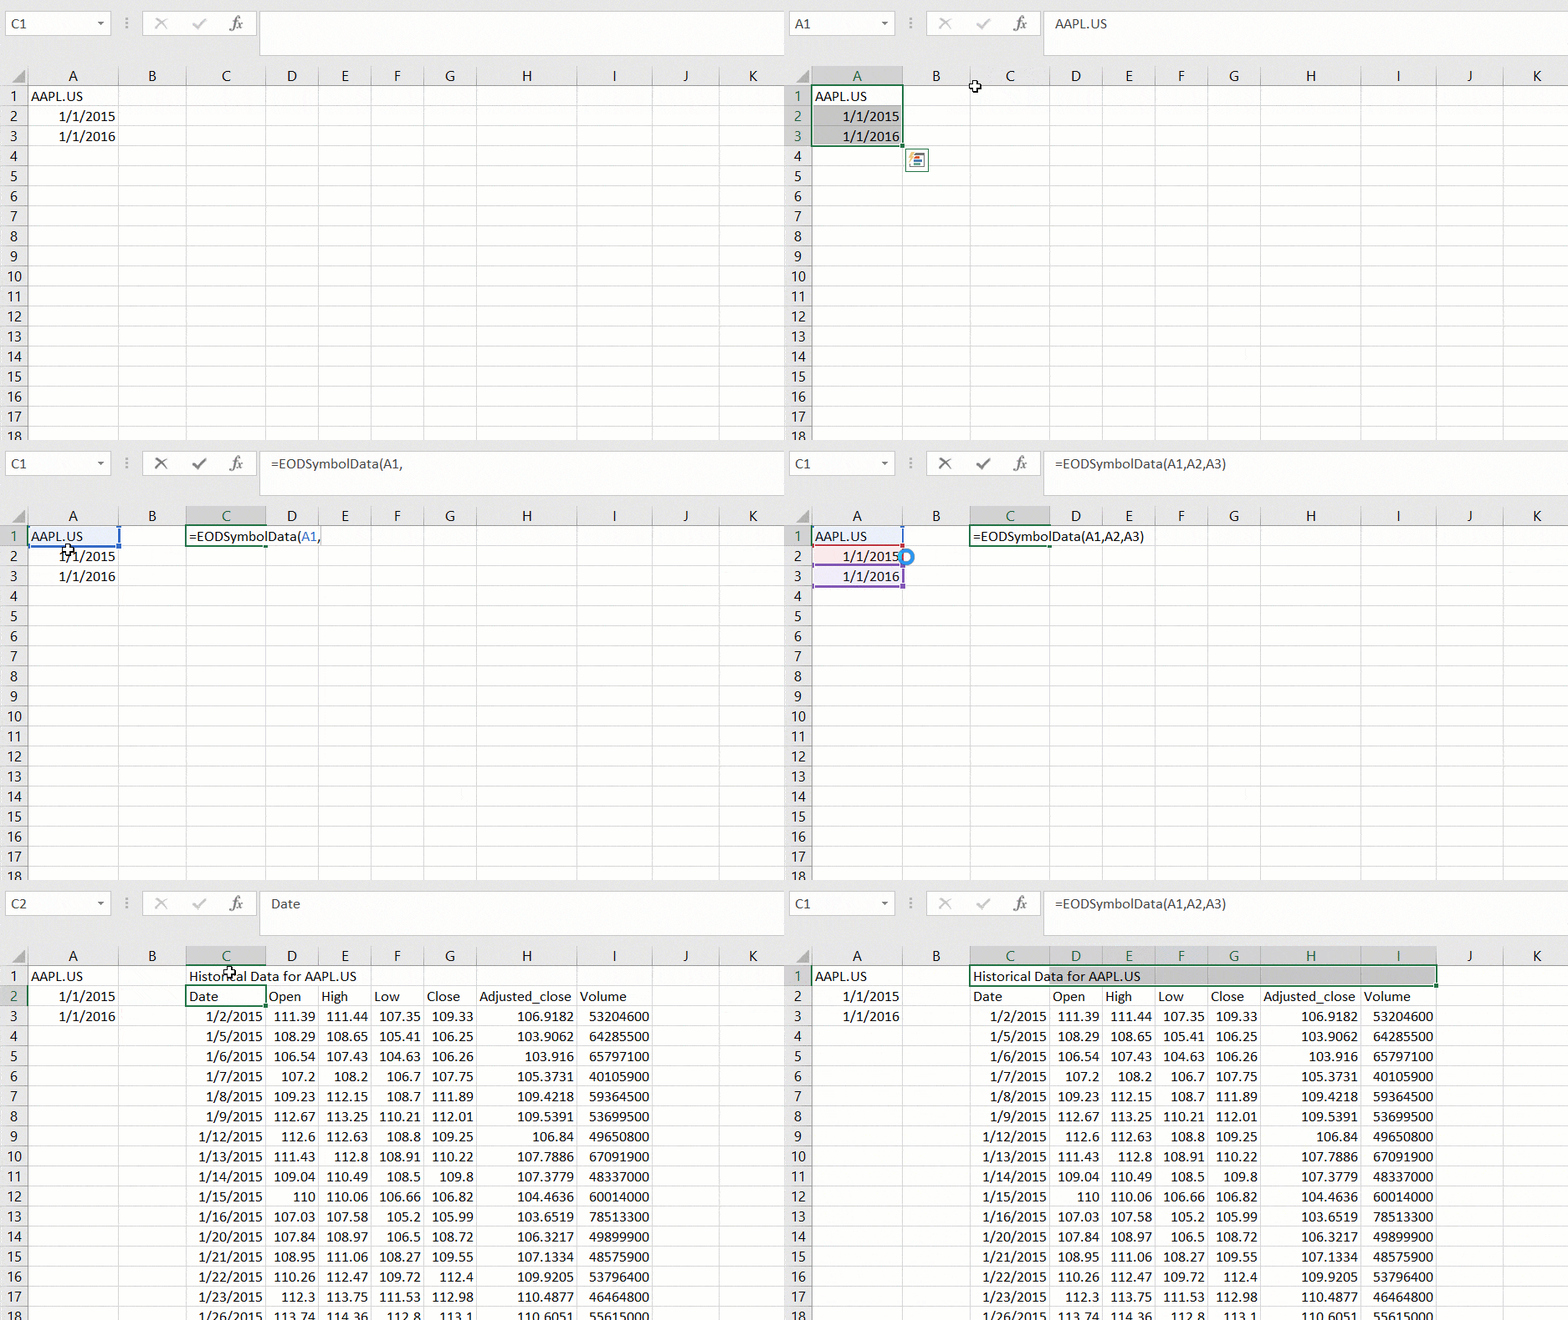
To access our API, you can use our defined function “=EODSymbolData(Symbol, From_Date, To_Date).” It’s easy like you use other functions “=SUM(…)” or “=AVERAGE(…)”
Dont forget to change DEMO key to your own. The current key works only with AAPL.US.
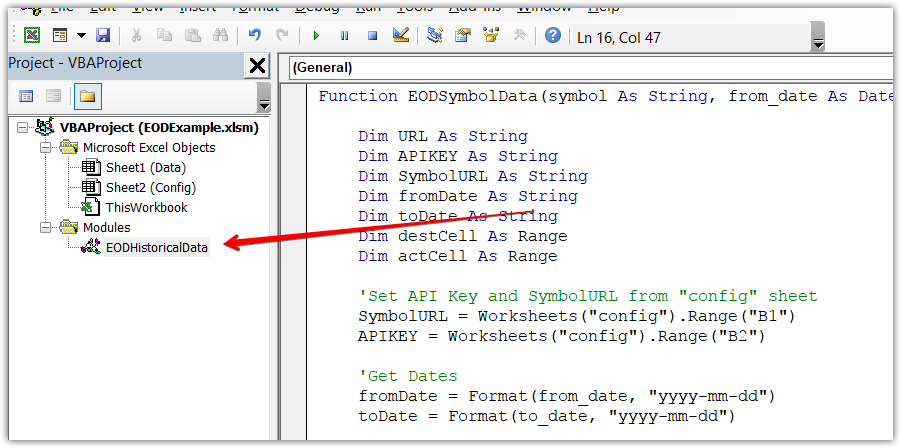
To see the code, please push ALT+F11 and open VBA Module ‘EODHistoricalData’ to check the VBA function:
Download our XLS-file example for getting EOD Historical Data via API and check the source to create your spreadsheet
Excel VBA script for multiple (bulk) downloads
Here you can find an Excel VBA script for multiple (or bulk) downloads: vba-multiple-download-new 2.1.xlsm. It’s easy to test and use. Just follow these two steps:
- Change the “demo” API KEY to your API KEY, since the “demo” API Key will work only with AAPL.US
- Add stocks you want to download.
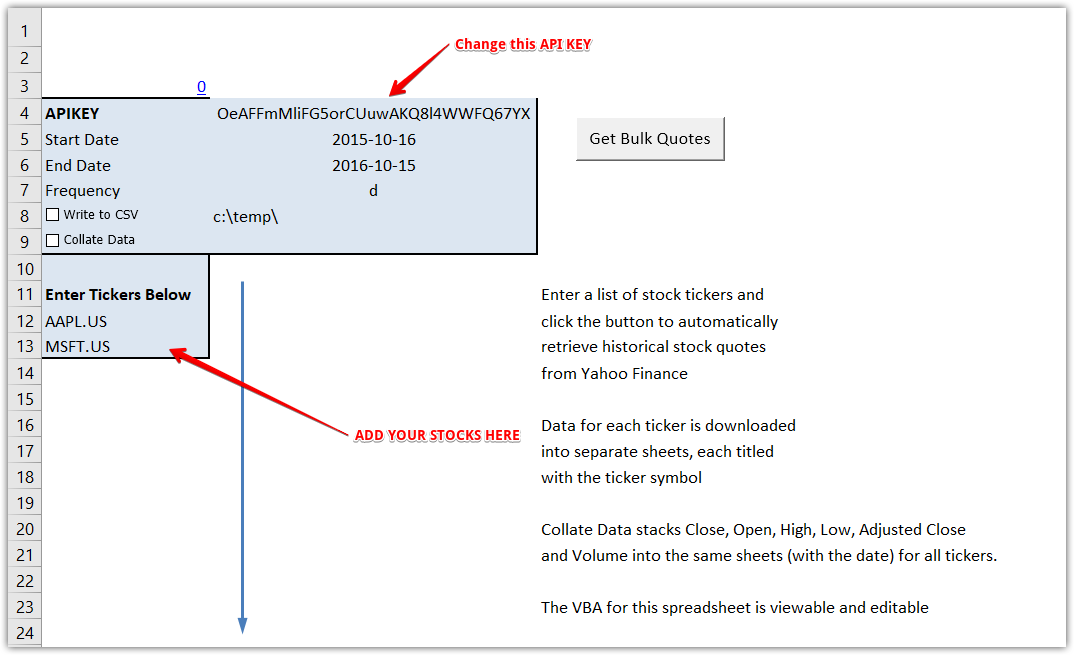
October 2024 update. By clicking the “Get dividends” button, dividends are downloaded for the tickers listed in the ticker column. The “from” and “to” dates also work and are passed in the request. A separate tab is created for each company’s dividends.
LIVE API Excel Webservice support
In order to access data via Excel Webservice feature, keep in mind this tip.
If you need only any one field, use ‘filter=FIELDNAME’ parameter. For example, if you use the following URL:
https://eodhd.com/api/real-time/AAPL.US?api_token=demo&fmt=json&filter=close
Then only one number will be returned: 172.5. Which is very useful for Excel WEBSERVICE function like this:
=WEBSERVICE(https://eodhd.com/api/real-time/AAPL.US?api_token=demo&fmt=json&filter=close)
EODHD offers finance API for stock data Excel. In case if you have more questions and need an assistance with Excel add-on contact us through chat or via email support@eodhistoricaldata.com.