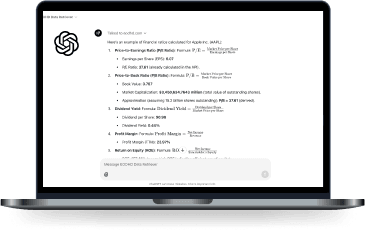
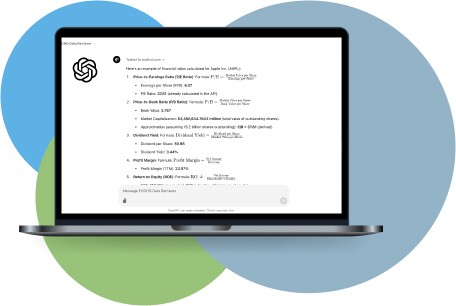
Fundamental Data

Balance sheets, income statements, cash flow, etc

Live prices

On a screen or as downloads, graphs, tables

Financial Events

Earnings, splits, IPOs including EPS estimates

Financial News

Retrieve and analyse new for s specific company

And much more....

Hi! I'm your new financial assistant.
Unlike most AI bots, I work with historical and real-time financial data provided by EODHD.

Step 1

Demo mode

Start exploring right away! You can test me with demo data for Apple, Microsoft, and Tesla. No sign-up required - just ask me about these companies.

Step 2

Sign up on eodhd.com

Not a user yet? Signing up is free and gives you access to more data. Subscribing to one of our advanced plans unlocks even greater possibilities, allowing me to access an extensive range of data for your queries.

Step 3

Provide your API key to the assistant

Once you sign up on eodhd.com, you’ll receive your own API key. I need this key to retrieve data for you - give it to me in the chat. Don’t worry - your key is completely secure. I only use it within your session, and I don’t store or share your information with anyone.These are the essential principles of ChatGPT.

Step 4

Ask the assistant anything

Start asking your questions! The first time you make a request, I’ll connect to our server to fetch the data. Once the connection is established, I’ll handle every request seamlessly. Need to save responses as files or images? Just let me know!

Here are a few ideas of what you can ask me:

Financial News and sentiment
- What is the sentiment for Tesla in recent news?

Recent sentiment analysis for Tesla (TSLA.US) news shows varying trends:

  • Negative Sentiment: November 22, 2024, with a normalized score of -0.2555.
  • Neutral to Slightly Positive: November 21-20, 2024, scores ranged from 0.0475 to 0.148.
  • Strong Positive Sentiment: Examples include November 19, 2024 (0.612), November 18, 2024 (0.3508), and November 16, 2024 (0.08).
  • Mixed Trends: Sentiment for earlier dates like November 15-12, 2024, shows fluctuating positive scores around 0.1247 to 0.5202.

Overall, Tesla's sentiment in recent news appears mostly positive with occasional neutral and slightly negative mentions. Let me know if you need more specific details!

Ask me more
Building graphs
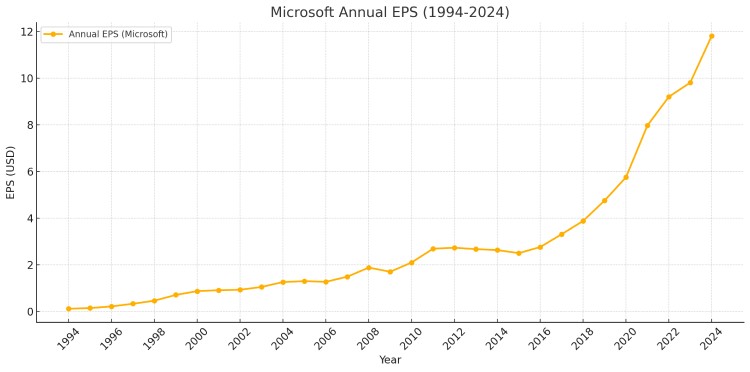
- Build a graph for Microsoft annual EPS

Here is the graph depicting Microsoft's Annual EPS from 1994 to 2024:

Ask me more
EOD prices as downloads
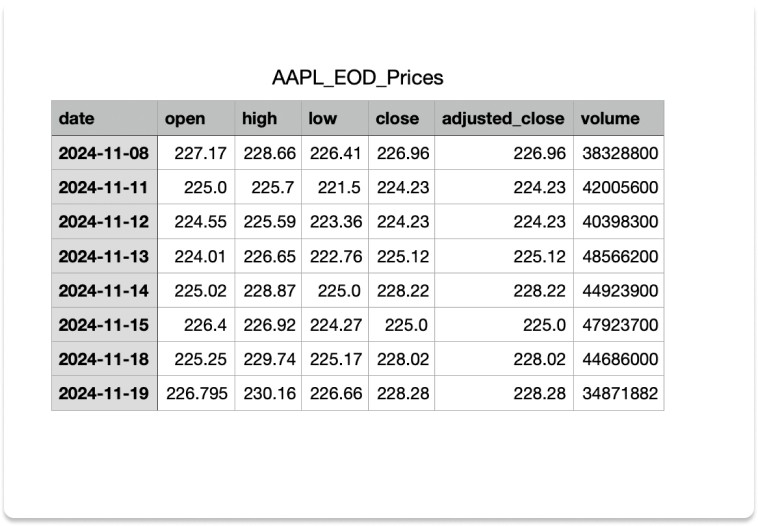
- Create CSV file for AAPL EOD prices for AAPL from 08.11.2024 till today

Here is the file with EOD prices for AAPL ticker:

Ask me more
Dividend and Split History Retrieval
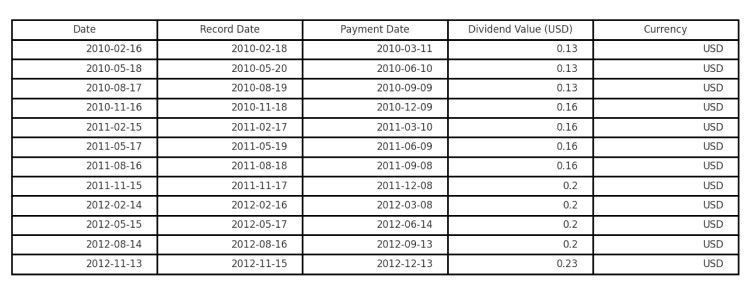
- Fetch the historical dividend payouts for Microsoft (MSFT) since 2010

I have retrieved the dividend data for Microsoft (MSFT) from January 2010 through December 2024. Below is an excerpt from the data, showing the dividend payment details:

Ask me more
Screening and Filtering Stocks
- Find all technology companies in the U.S. with a market cap above $10 billion and a dividend yield over 2%.

Here are the U.S. technology companies with their market capitalizations and dividend yields:

1. Cisco Systems Inc (CSCO) - $236.89 billion, 2.69%
2. International Business Machines (IBM) - $211.74 billion, 2.94%
3. Qualcomm Incorporated (QCOM) - $180.63 billion, 2.09%
4. Texas Instruments Incorporated (TXN) - $179.92 billion, 2.70%
5. AT&T Inc ELKS (TBC) - $139.57 billion, 5.30%
6. Automatic Data Processing Inc (ADP) - $123.69 billion, 2.01%
7. Intel Corporation (INTC) - $96.91 billion, 2.24%
8. Infosys Ltd ADR (INFY) - $92.06 billion, 2.25%
9. Hon Hai Precision Industry Co Ltd ADR (HNHPF) - $83.67 billion, 2.72%
10. Paychex Inc (PAYX) - $52.00 billion, 2.70%
11. Microchip Technology Inc (MCHP) - $37.76 billion, 2.78%
12. HP Inc (HPQ) - $35.44 billion, 2.82%
13. Amadeus IT Group S.A (AMADF) - $31.63 billion, 2.98%
14. Canon Inc. (CAJPY) - $31.24 billion, 2.96%
15. Hewlett Packard Enterprise Co (HPE) - $27.66 billion, 2.44%

Ask me more
Insider Transactions Analysis
- Show recent insider trading activity for Meta Platforms (META) over Q4.

Susan J Li (CFO)

  • Transaction Date: 2024-11-18
  • Action: Sale of 18,644 shares at $553.55 per share.
  • Details

Mark Zuckerberg (CEO)

  • Transaction Date: 2024-10-30
  • Action: Sale of 420 shares at $600.17 per share.
  • Details

Jennifer Newstead (Insider)

  • Transaction Date: 2024-10-01
  • Action: Sale of 905 shares at $578.55 per share.
  • Details

Ask me more
Macroeconomic Data Retrieval
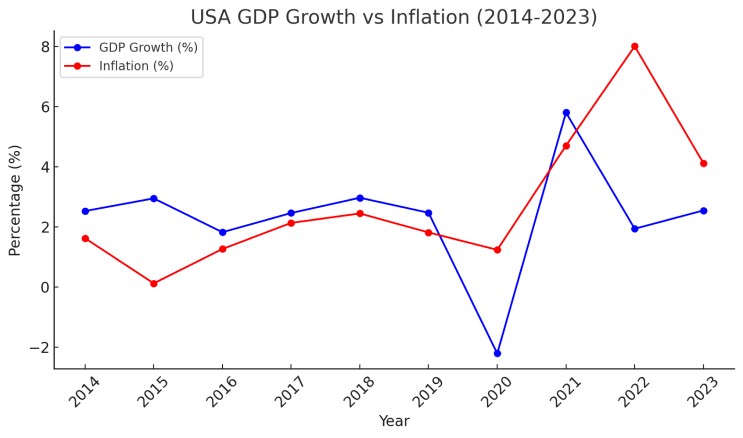
- How does US inflation compare with GDP? Over the last decade.

Here is a comparative visualization of GDP Growth (%) and Inflation (%) in the United States over the past decade.

Ask me more
Upcoming Earnings Reports
- List all companies reporting earnings in the next week.

Here are companies reporting earnings on December 4, 2024, with some of their available metrics:

1. Cisco Systems Inc (CSCO) - Before Market, Actual EPS: $3.63, Estimate: $3.47
2. LOVE USA (LOVE) - Before Market, Estimate: Not available
3. Royal Bank of Canada (RY) - Before Market, Estimate: Not available
4. Snap-on Inc (SNPS) - After Market, Estimate: $3.30
5. Campbell Soup Co (CPB) - Before Market, Actual EPS: $0.89, Estimate: $0.88

This is a small subset of a long list. If you'd like the complete details or a focus on a specific set of companies, please let me know!

Ask me more
Index Analysis
- Retrieve the components of the S&P 500 (GSPC.INDX) with their respective sector weights.

Here are the top 15 components of the S&P 500 (GSPC.INDX) by weight:

1. Apple Inc (AAPL) - Sector: Technology, Weight: 7.21%
2. Microsoft Corporation (MSFT) - Sector: Technology, Weight: 6.26%
3. NVIDIA Corporation (NVDA) - Sector: Technology, Weight: 6.74%
4. Amazon.com Inc (AMZN) - Sector: Consumer Cyclical, Weight: 3.90%
5. Alphabet Inc Class A (GOOGL) - Sector: Communication Services, Weight: 1.96%
6. Tesla Inc (TSLA) - Sector: Consumer Cyclical, Weight: 1.91%
7. Meta Platforms Inc. (META) - Sector: Communication Services, Weight: 2.62%
8. Berkshire Hathaway Inc (BRK-B) - Sector: Financial Services, Weight: 1.68%
9. Alphabet Inc Class C (GOOG) - Sector: Communication Services, Weight: 1.62%
10. UnitedHealth Group Incorporated (UNH) - Sector: Healthcare, Weight: 1.09%
11. Visa Inc. Class A (V) - Sector: Financial Services, Weight: 1.02%
12. Exxon Mobil Corp (XOM) - Sector: Energy, Weight: 1.02%
13. Johnson & Johnson (JNJ) - Sector: Healthcare, Weight: 0.72%
14. Procter & Gamble Company (PG) - Sector: Consumer Defensive, Weight: 0.81%
15. Mastercard Inc (MA) - Sector: Financial Services, Weight: 0.85%

Ask me more

Trusted by people,
proven through success stories

We are proud to witness an incredible number of projects developed and launched with the assistance of the data we provide. This motivates us to continuously enhance our service.

Questions & Answers

Feel free to ask us anything related to our service & subscription plans in live chat.
You'll only find real assistants on the other end.

We have created an assistant designed to retrieve data not from the internet but directly from our server, which houses a vast amount of financial data. The assistant excels at providing real-time prices, fundamental data, and historical data. Beyond simply delivering this information, it can analyze, calculate, and generate insightful visualizations such as graphs.

If the assistant requests permission to connect to eodhd.com, this is normal and required for retrieving data.

Before using the assistant, you must provide your API token - a secret key you will receive upon registering with us on eodhd.com. We offer various subscription plans that grant access to different types of data.

Our assistant is specifically trained to work with our proprietary financial data, not general information available on the internet. It interacts directly with our servers to retrieve data relevant to your queries and knows how to process and present this data in a meaningful way.
While the assistant itself is free, accessing our data depends on the subscription plan you choose. We offer both free and paid plans. The free plan provides limited access, such as up to 1 year of historical data, dividends, and splits. Paid plans start at $19.99 and include access to 30 years of historical data, financial news, fundamental data, and much more.
We welcome your suggestions! Let us know what additional capabilities you would like the assistant to have, and we will explore adding new features and training it further. Share your ideas with us here: support@eodhistoricaldata.com
Yes, all data requests are linked to your API key and correspond to your subscription plan. If you're unfamiliar with our API call system, we recommend reading our article about how it works.
The assistant can retrieve a broad range of financial data, including:
  • - Real-time stock prices
  • - End-of-day data
  • - Fundamental metrics (e.g., P/E ratio, market capitalization)
  • - Historical data (daily, weekly, monthly)
  • - Dividend and split history
  • - ETF and index data
  • - Financial news and sentiment analysis
It is also capable of calculating complex financial ratios and generating insights based on this data.
Your API key is handled securely by the assistant and is only used to make requests to our servers on your behalf. It is not stored or shared with third parties. For added security, we recommend keeping your API key private and rotating it periodically.
Yes, the assistant can filter and retrieve data for specific sectors or industries. For example, it can identify companies in the technology sector with high dividend yields or those in the healthcare industry with strong market capitalization growth.
Absolutely! The assistant supports data from over 60 global exchanges. Whether you are looking for data from the NASDAQ, London Stock Exchange, or markets in Asia, the assistant can provide detailed information tailored to your needs.
The data is updated frequently to provide real-time (<50ms update) and near-real-time accuracy, especially for stock prices, financial news, and market trends. Historical and fundamental data is updated as per company filings and exchange reporting cycles.
Yes, the assistant can assist with portfolio analysis by retrieving data for multiple tickers and comparing their performance, growth metrics, valuation ratios, and other financial indicators. It can also calculate metrics like weighted average returns and risk ratios.
No worries! The assistant simplifies everything for you. Just describe what you need—for example, “Get me the historical stock prices for Apple”—and the assistant will handle the API calls and present the data.
Chat