If you are not a developer but still need access to data and tools such as stock prices, end-of-day (with charts), intraday, and fundamental data API, screeners, various technical indicators, among others, we recommend trying our Excel and Google Sheets add-ons. With these add-ons, financial data for stocks, ETFs, mutual funds, and FOREX markets is now available on any device without coding. Our add-ons are free for demo purposes but require a quick registration on our EODHD site to obtain a free API key.


1. You can start with “DEMO” API key to test the data for a few tickers only: AAPL.US, TSLA.US , VTI.US, AMZN.US, BTC-USD and EUR-USD. For these tickers, all of our types of data (APIs), including Real-Time Data, are available without limitations.
2. Register for the free plan to receive your API key (limited to 20 API calls per day) with access to End-Of-Day Historical Stock Market Data API for any ticker, but within the past year only. Plus a List of tickers per Exchange is available.
3. We recommend to explore our plans, starting from $19.99, to access the necessary type of data without limitations.
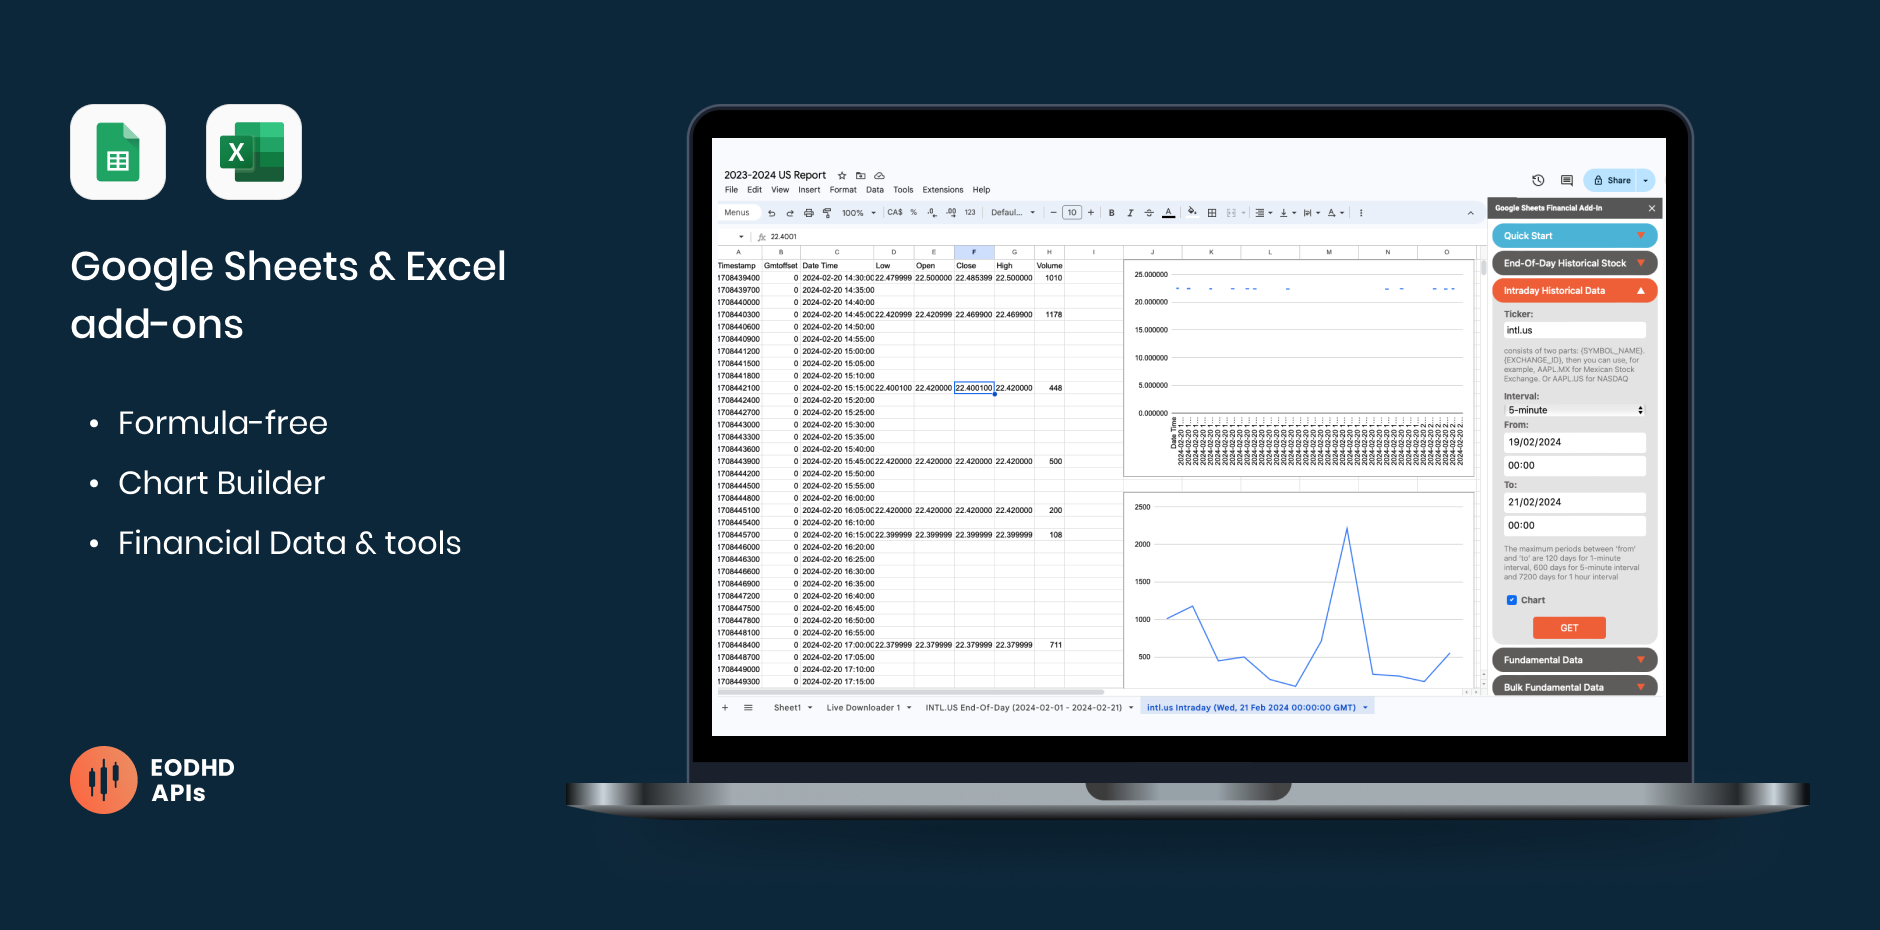
Our Google Sheets & Excel add-ons are based on our API but do not require any developer skills to retrieve data. They are even formula-free – the data inserts automatically into your table, with automatic chart building, when you choose the needed option from the list. Which type of data can you find in our add-ons?
Real-time & Historical Data for Stocks, ETFs, Mutual Funds and more
| Real-Time Prices | Coming Soon | Coming Soon |
| Live-Delayed Prices |  | Coming Soon |
| EOD Prices | View example | |
| Intraday Historical Data | | |
| Historical Dividends | | |
| Historical Splits | | |
Fundamental Data for Stock & ETFs
| Stocks Fundamental Data | | |
| ETFs Fundamental Data | | |
| Funds Fundamental Data | | |
| Indices Fundamental Data | | |
| Insider Transactions | | |
| Bulk Request Fundamental API | | |
Technical Indicators for Stocks, ETFs, Funds and FOREX
Installation guide
Find bellow detailed instructions how to install add-ons, activate API key and make your first requests: