In addition to our previous official R library we are proud to present to you second version of a library (eodhdR2) made by independent developer Prof. Marcelo S. Perlin.
R is an open-source programming language that has gained immense popularity in the data science community for its robust statistical capabilities and visualization tools. Whether you’re a budding data analyst or a professional trader, EODHD’s R library provides a versatile environment for handling vast financial data, creating visualizations, and conducting sophisticated analyses.
In this quick guide, we will show you how to install the latest library and use its most popular functions.
Installation and examples
First things first, ensure you have R and RStudio installed on your machine. RStudio is an integrated development environment (IDE) that makes working with R more convenient. The suggested steps are:
- Install the latest R version for your platform (Windows/Mac/Linux) from https://cran.r-project.org/
- Install the latest RStudio from https://posit.co/products/open-source/rstudio/. Alternatively, you can also use R with Microsoft’s vscode.
Feel free to visit our Github page to subscribe to receive notifications about future updates for he R library.
R library installation process
- To install the library, open RStudio, and copy and paste the following command in the prompt (bottom left of screen), and hit Enter:
# stable version available at CRAN
install.package("eodhdR2")

# development version
if (!require(devtools)) install.packages("devtools")
devtools::install_github("EodHistoricalData/R-Library-for-financial-data-2024")
This command will install all dependencies of the package. This might take a while depending on your internet connection and hardware.
- Next, let’s import eodhdR2 library for accessing its functions:
library(eodhdR2)If you are able to execute the previous code without error, then the package was installed correctly and you’re good to go. The next step is activating the API with a valid token, and executing the code examples.
Activating the API
If you haven’t done so, register a new account at https://eodhd.com/. Once you done that, head out to https://eodhd.com/cp/dashboard and search for your unique API Token. This token is attached to your data subscription. If you only subscribed to fundamentals, it will not work for other types of data. We recommend exploring our plans, starting from $19.99, to access the necessary type of API without limitations.

While using eodhdR2, all authentications are managed with function eodhdR2::set_token():
Alternatively, EODHD offers a DEMO API key to test the data for a few tickers only: AAPL.US, TSLA.US , VTI.US, AMZN.US, BTC-USD and EUR-USD. We recommend you test your access to the API with the demo token:
✔ eodhd API token set
ℹ Account name: API Documentation 2 (supportlevel1@eodhistoricaldata.com)
ℹ Quota: 88838 | 10000000
ℹ Subscription: demo
✖ You are using a **DEMONSTRATION** token for testing pourposes, with limited access to the data repositories. See <https://eodhd.com/> for registration and, after finding your token, use it with function eodhdR2::set_token(“TOKEN”).
Getting Help
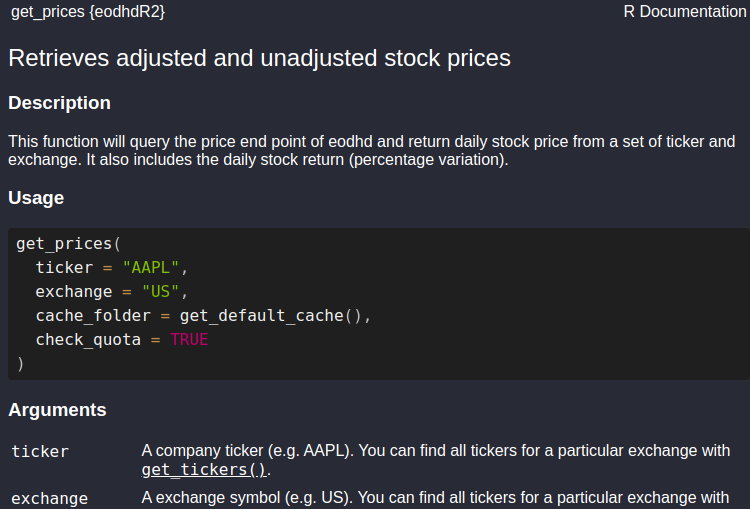
To access all information about a specific function, you can use the help command:
Example of help for function get_prices():
List of the available functions
For testing all functions, except, get_exchanges() and get_ticker(), you can use the demo token. Make sure to register it in your R session before executing the code. The instruction are available in previous section Activating the API.
get_demo_token: Returns the demo token
get_dividends: Returns dividend history for a given ticker and exchange.
get_exchanges: Returns the list of available exchanges. Be aware you need a non-demo token for this function.
get_fundamentals: imports fundamental data from eodhd.
get_prices: Imports daily adjusted/unadjusted prices trading volumes from eodhd.
get_splits: retrieves split data from eodhd.
get_tickers: retrieves a list of tickers for a particular exchange. Be aware you need a non-demo token for this function.
parse_financials: organizes financial data imported using get_fundamentals(). The output is a dataframe in the long/wide format.
set_token: authenticates R session with eodhd by setting a token in registry
Testing for AAPL ticker
These are examples of using eodhdR2 for APPLE INC (AAPL), which trades on the US exchange. These requests are done with “demo” token.
Retrieving Financial Prices
ticker <- "AAPL" # AAPL is the ticker for APPLE INC
exchange <- "US" # AAPL is traded in the US market

# fetch prices from eodhd price endpoint
df_prices <- eodhdR2::get_prices(ticker, exchange)
── retrieving price data for ticker AAPL|US─────────────────────
! Quota status: 89475|10000000, refreshing in 3.72 hours
ℹ cache file ‘/tmp/RtmpyEk3VW/eodhdR2-cache/AAPL_US_eodhd_prices.rds’ saved
✔ got 11008 rows of prices
ℹ got daily data from 1980-12-12 to 2024-08-13
# check the result
dplyr::glimpse(df_prices)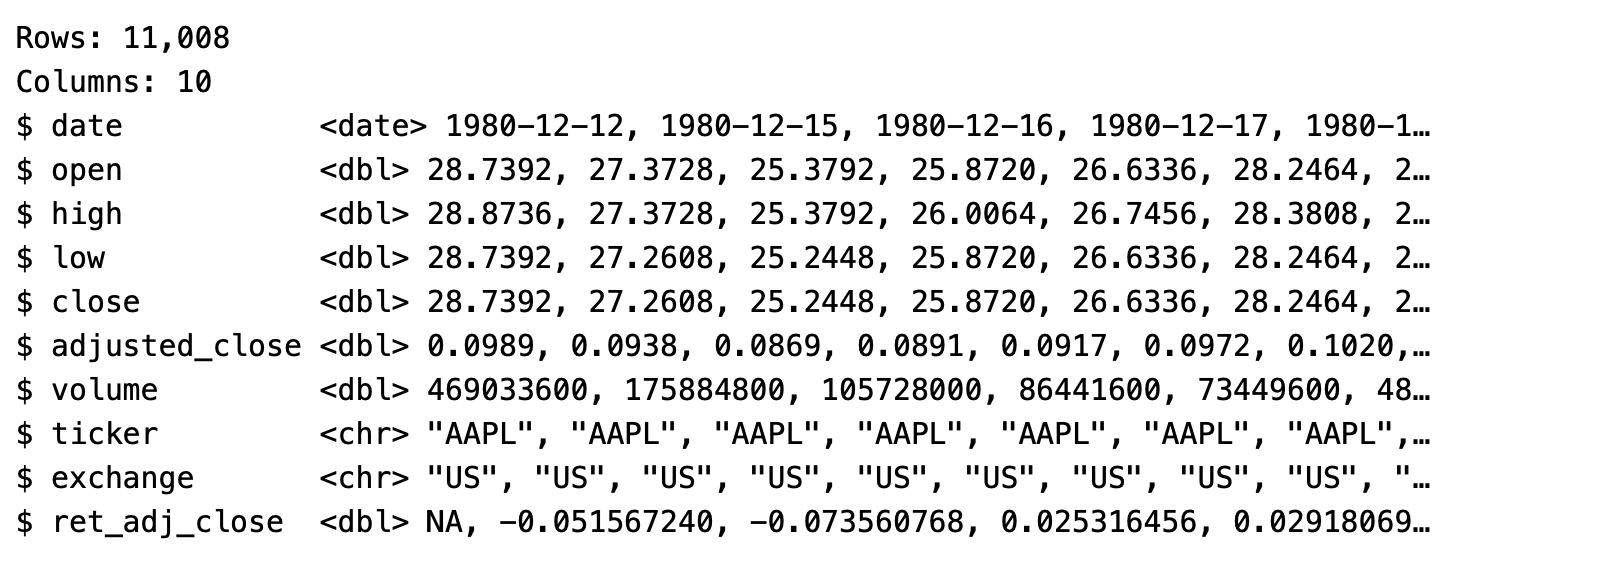
Now, let’s use ggplot2 to make a plot of the price series for the past five years:
library(ggplot2)

first_date <- Sys.Date() - 5*365 # last  5 years
last_date <- Sys.Date()

df_prices <- df_prices |>
  dplyr::filter(
    date >= first_date,
    date <= last_date
    )

p <- ggplot(df_prices, aes(y = adjusted_close, x = date)) +
  geom_line() +
  theme_light() +
  labs(title = "Adjusted Prices of AAPL",
       subtitle = "Prices are adjusted to splits, dividends and other corporate events",
       x = "Data",
       y = "Adjusted Prices",
       caption = "Data obtained with package eodhdR2")

p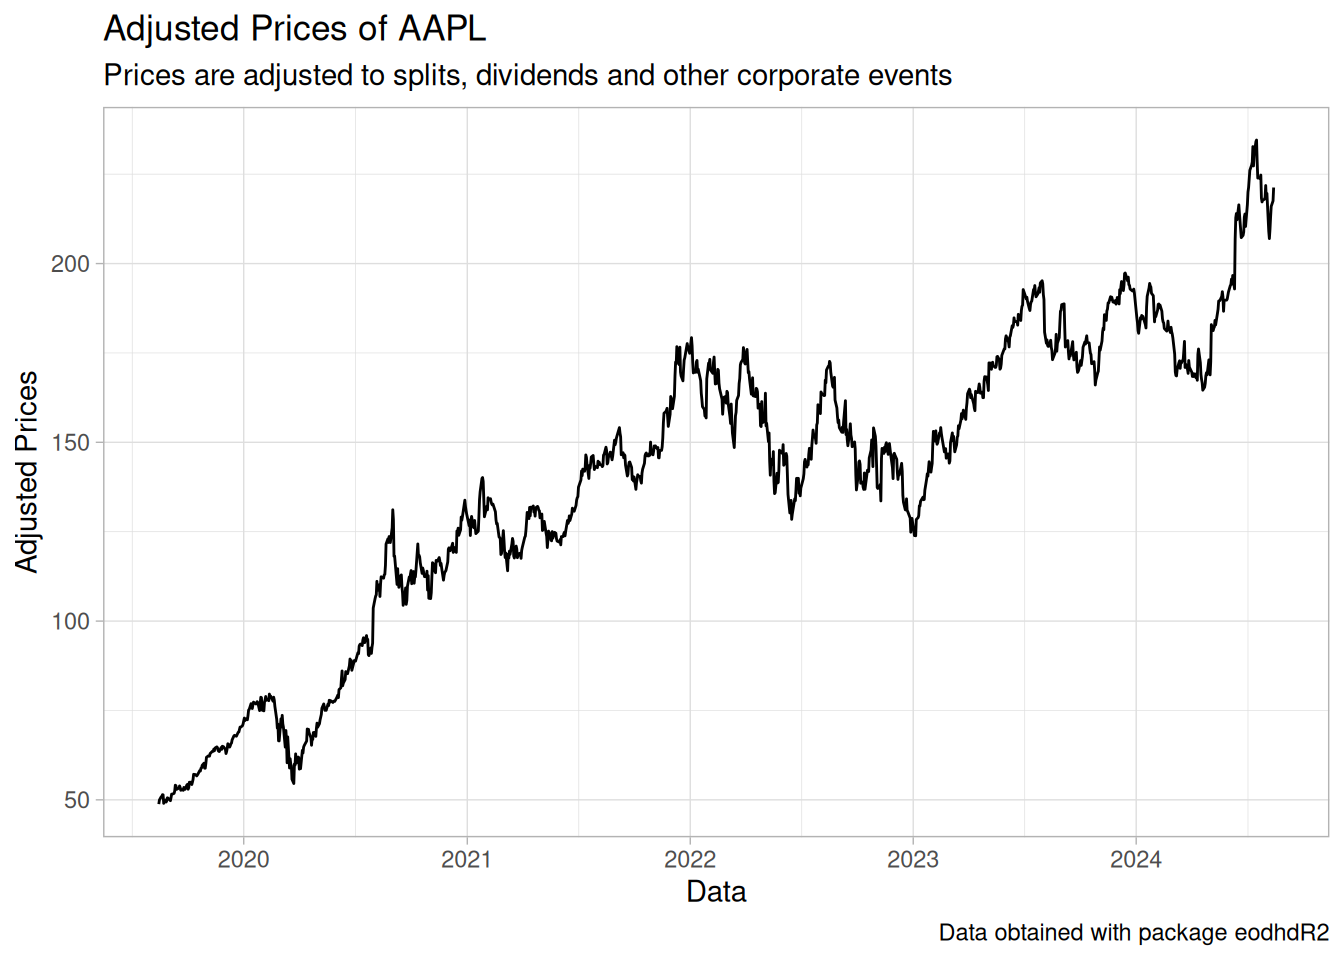
Retrieving Dividends
We can also import the dividend history of APPLE INC.
ticker <- "AAPL" # AAPL is the ticker for APPLE INC
exchange <- "US" # AAPL is traded in the US market

# fetch data from the dividends endpoint and filter for dates
df_div <- eodhdR2::get_dividends(ticker, exchange) |>
  dplyr::filter(
    date >= first_date,
    date <= last_date
    )
── retrieving dividends for ticker AAPL|US──
! Quota status: 89478|10000000, refreshing in 3.72 hours
ℹ cache file ‘/tmp/RtmpyEk3VW/eodhdR2-cache/AAPL_US_eodhd_dividends.rds’ saved
✔ got 84 rows of dividend data
# check the data
dplyr::glimpse(df_div)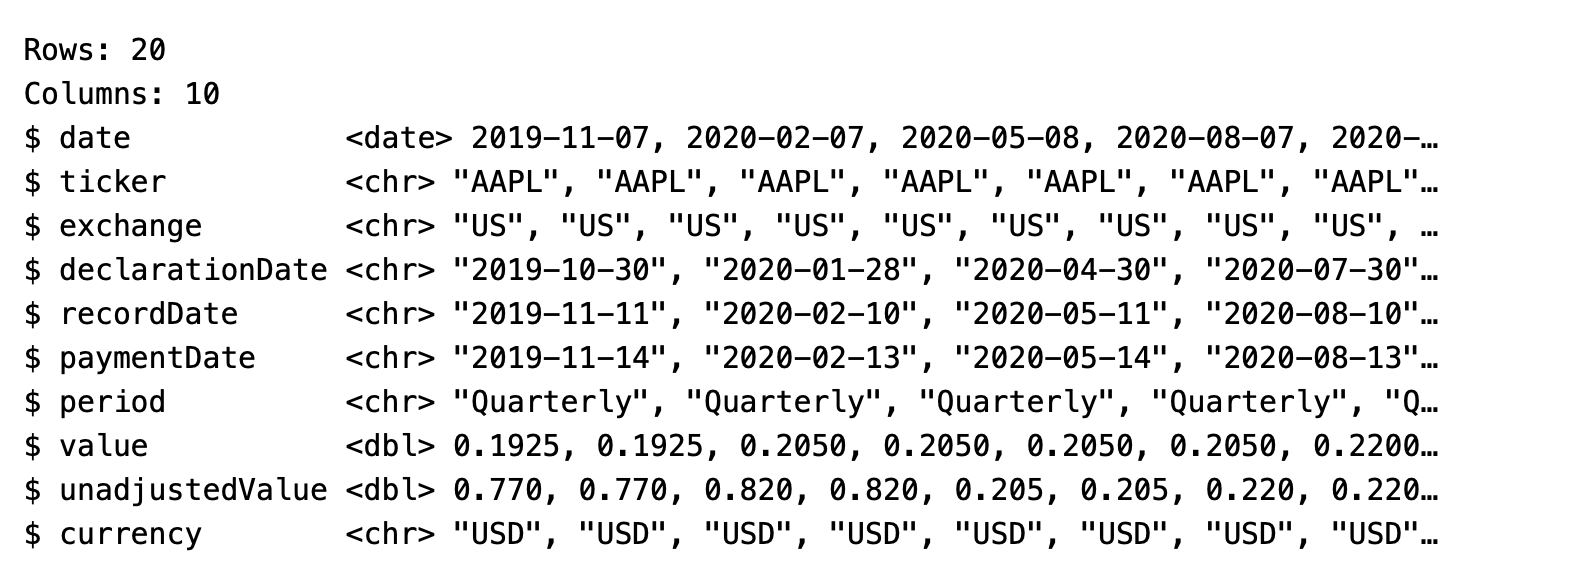
Again, lets plot the dividend history since 2019-08-15:
library(ggplot2)

p <- ggplot(df_div, aes(y = value, x = date)) +
  geom_point(size = 2) +
  theme_light() +
  labs(title = "Adjusted Dividends of AAPL",
       x = "Data",
       y = "Adjusted Dividends")

p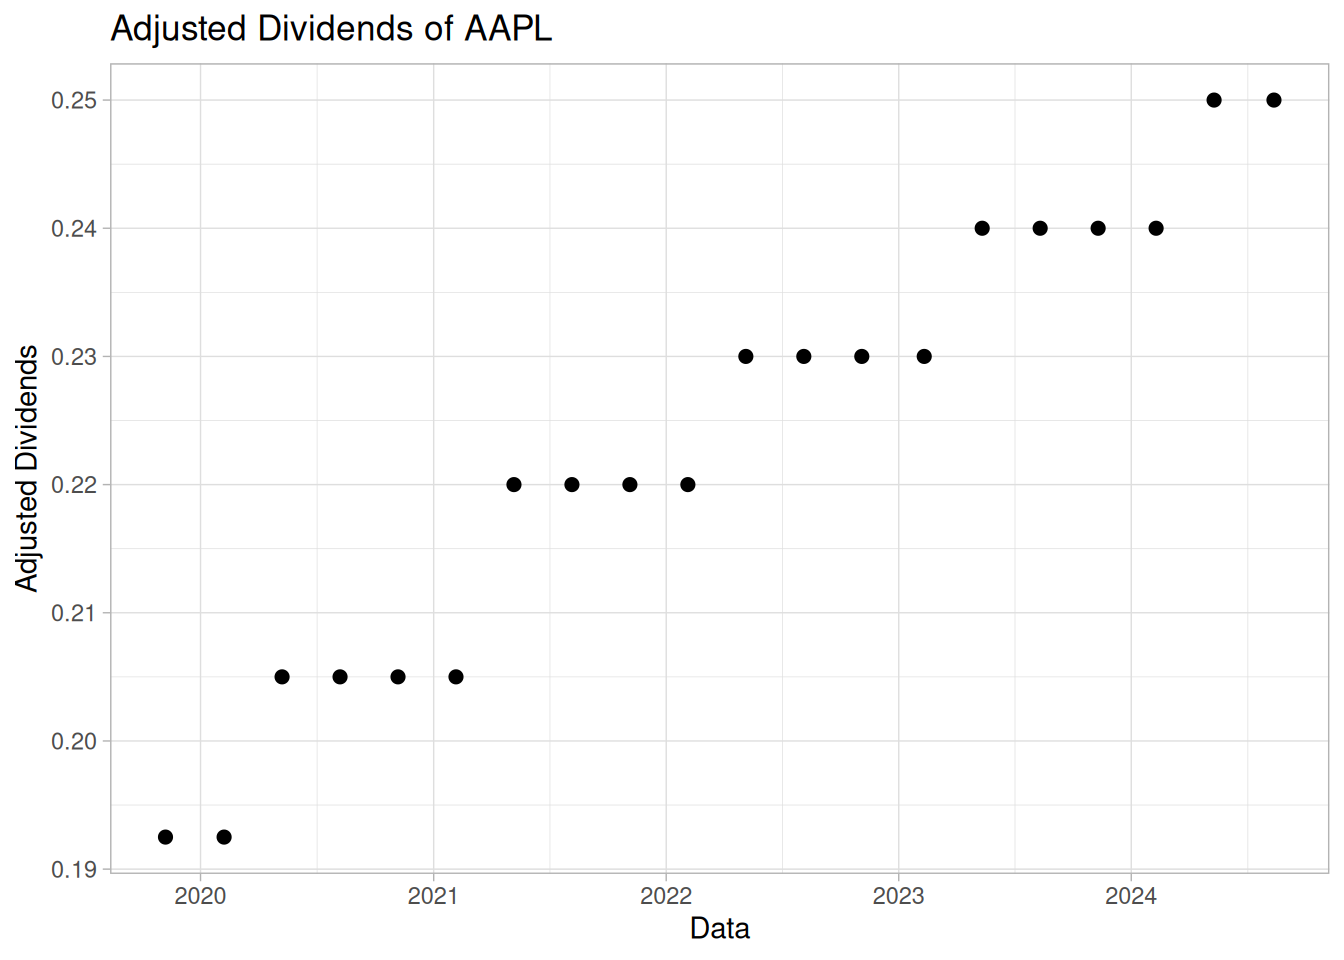
Retrieving Fundamentals
We can use the same interface for fetching fundamental data from the EODHD endpoint.
ticker <- "AAPL" # AAPL is the ticker for APPLE INC
exchange <- "US" # AAPL is traded in the US market

# fetch the data
l_fun <- eodhdR2::get_fundamentals(ticker, exchange)
── retrieving fundamentals for ticker AAPL|US──
! Quota status: 89480|10000000, refreshing in 3.72 hours
✔ querying API
✔ got 13 elements in raw list
# results is a list, lets check its content
names(l_fun)
[1] “General” “Highlights” “Valuation”
[4] “SharesStats” “Technicals” “SplitsDividends”
[7] “AnalystRatings” “Holders” “InsiderTransactions”
[10] “ESGScores” “outstandingShares” “Earnings”
[13] “Financials”
Parsing financials
We can also use package eodhdR2 for parsing (organizing) the financial data from the raw output.
type_table <- "long" # lets produce a long table

# l_fun is the output of eodhdR2::get_fundamentals()
long_financials <- eodhdR2::parse_financials(l_fun, type_table)
── Parsing financial data for Apple Inc | AAPL ──
ℹ parsing Balance_Sheet data
ℹ quarterly
ℹ yearly
ℹ parsing Cash_Flow data
ℹ quarterly
ℹ yearly
ℹ parsing Income_Statement data
ℹ quarterly
ℹ yearly
✔ got 67680 rows of financial data (long format)
# check contents
head(long_financials)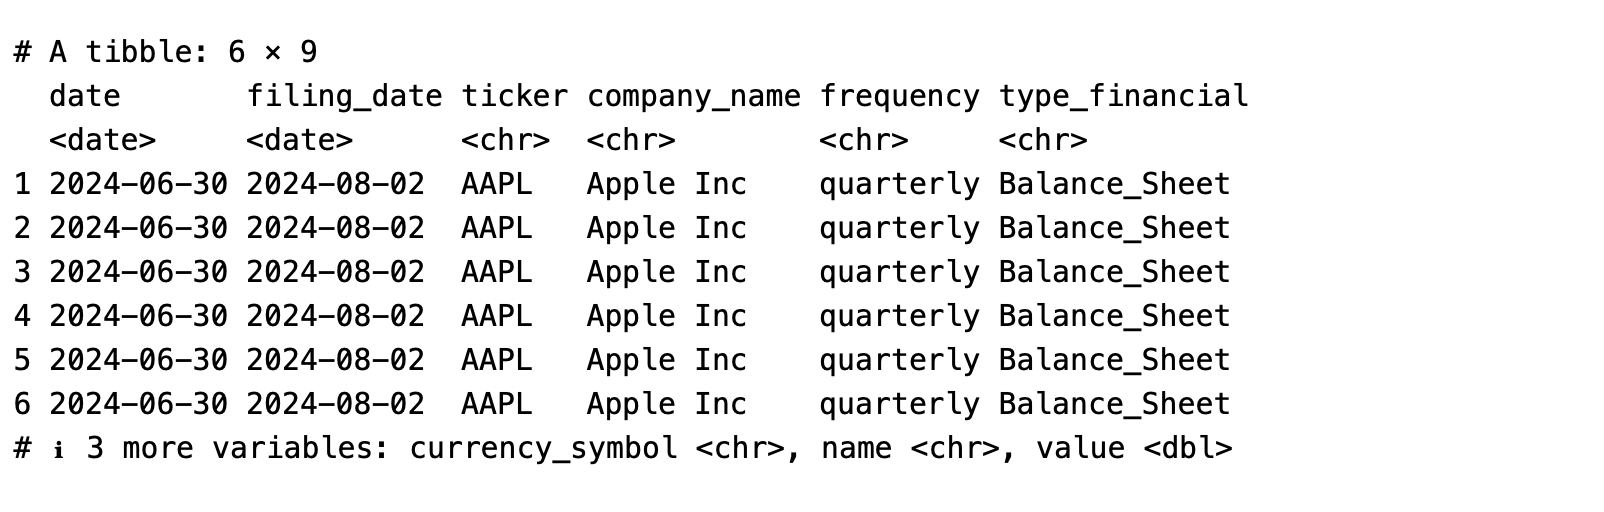
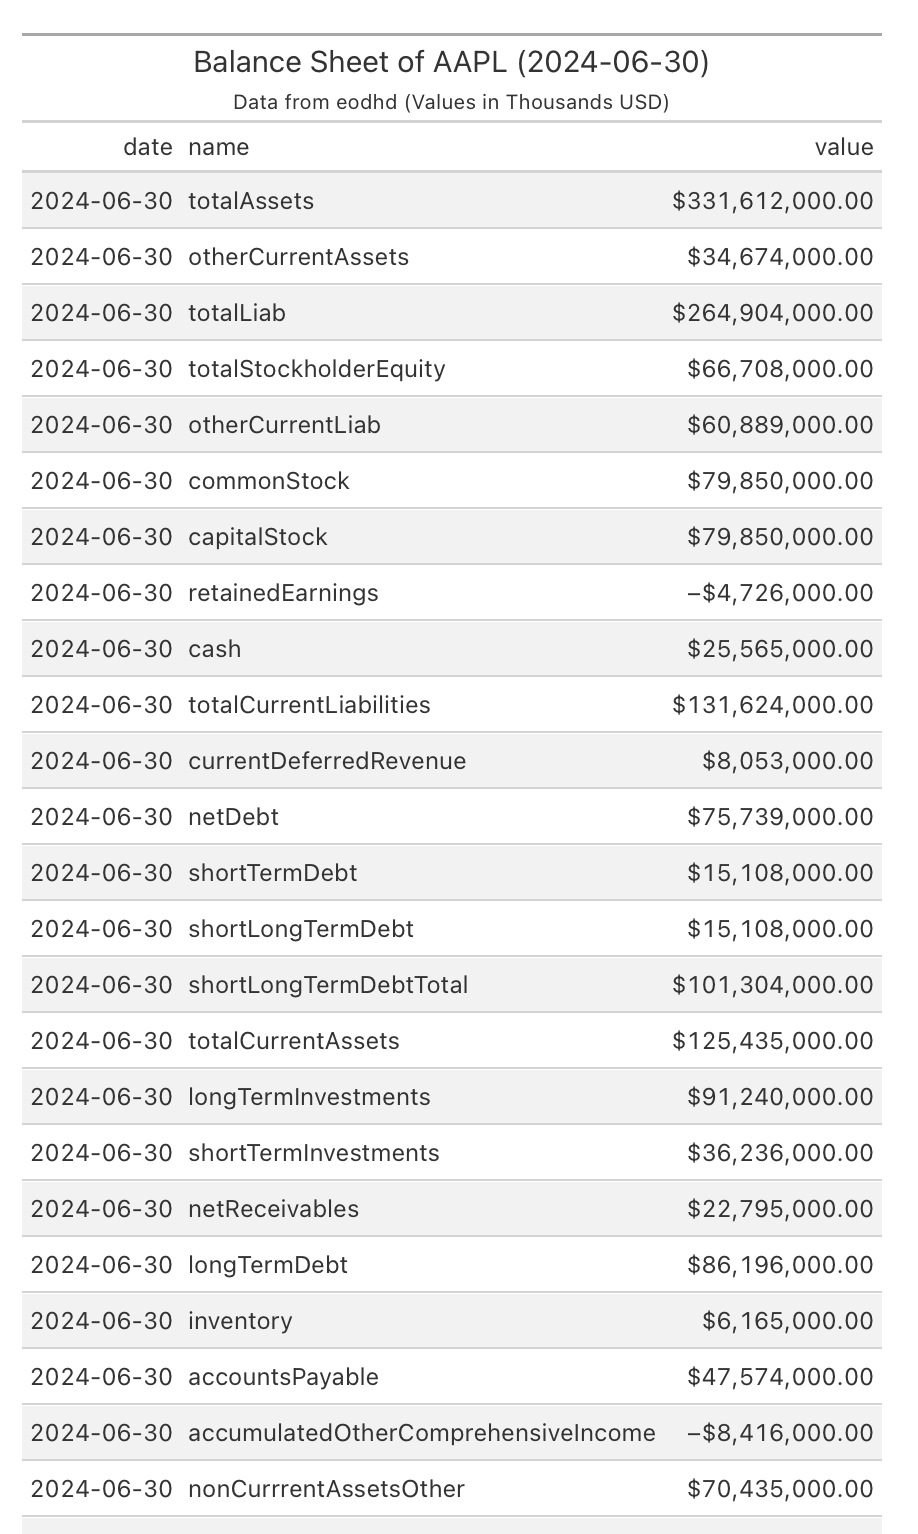
The last quarterly Balance Sheet of AAPL
Now that we have the financial data, let’s build a simple report of the last quarterly balance sheet of AAPL:
quarterly_bs <- long_financials |>
  dplyr::filter(
    frequency == 'quarterly',
    type_financial == "Balance_Sheet"
  )

last_date <- max(quarterly_bs$date)

last_bs <- quarterly_bs |>
  dplyr::filter(date == last_date)

last_bs |>
  dplyr::select(date, name, value) |>
  na.omit() |>
  gt::gt() |>
  gt::tab_header(
    title = paste0("Balance Sheet of AAPL (", last_date,")"),
    subtitle = paste0("Data from eodhd (Values in Thousands USD)")
  ) |>
  gt::fmt_currency(value, scale_by = 1/1000)