
Microsoft Excel provides a powerful platform for building custom financial dashboards and analysis tools. By creating a Stock Market Dashboard in Excel with the EODHD Financial APIs, you can make a robust spreadsheet that pulls in real-time historical and current market data.
This tutorial will walk through importing stock data from EODHD into Excel, setting up functions to fetch live quotes, and visualizing the data through charts and summaries.
You can also check our guides for How to Create Google Sheets Portfolio Tracker and EODHD Google Sheets Add-in. Here you’ll find more information on our Ready-to-Go solutions.
Download our Excel Stock Market Dashboard Template to follow the article:
Quick jump:
Connecting Excel to the EODHD API
Using the EODHD API requires registering for an API key. However, you can follow along with this article using the ‘demo’ key for the tickers AAPL, MSFT, TSLA, and MCD.
To import data from the EODHD API into Excel, we’ll use the WEBSERVICE function. This allows fetching data from a URL directly into cells.
In a new Excel spreadsheet, enter the following formula to pull in the list of supported stock exchanges:
=WEBSERVICE("https://eodhd.com/api/exchanges-list/?api_token=YOUR_API_KEY&fmt=json")
Replace YOUR_API_KEY with your EODHD API key. This will populate the sheet with a JSON array of the exchange data. You can change “&fmt=json” to “&fmt=csv” to get the data in CSV format instead.
WEBSERVICE function loads all the data in one cell, for one value this function would be sufficient. However, for a list of values, it’s better to transform the data using TEXTSPLIT and TRANSPOSE functions. An example of the cell formula is the following:
=TEXTSPLIT(WEBSERVICE("https://eodhd.com/api/exchanges-list/?api_token=YOUR_API_KEY&fmt=json"),":",",")
Similar to get the stock ticker list for a specific exchange, like the US market (code “US”):
=WEBSERVICE("https://eodhd.com/api/exchange-symbol-list/US?api_token=YOUR_API_KEY&fmt=json")
This returns all active US stocks and ETFs in JSON format.
Importing Historical EOD Data
To import historical end-of-day price data for a stock, use this formula:
=WEBSERVICE("https://eodhd.com/api/eod/AAPL.US?from=2022-01-01&to=2023-01-01&api_token=YOUR_API_KEY&fmt=json")
Adjust the ticker symbol, date range, and API key as needed. This will pull in the daily OHLCV data for Apple between the specified dates.
Getting live (Delayed) Stock Quotes
The EODHD API provides a live endpoint for fetching delayed price quotes. In a new sheet, enter:
=WEBSERVICE("https://eodhd.com/api/real-time/AAPL.US?api_token=YOUR_API_KEY&fmt=json&filter=close")
This gets the current trading price for AAPL. The “&filter=close” parameter returns only the last price. Remove the filter to get the full OHLCV quote.
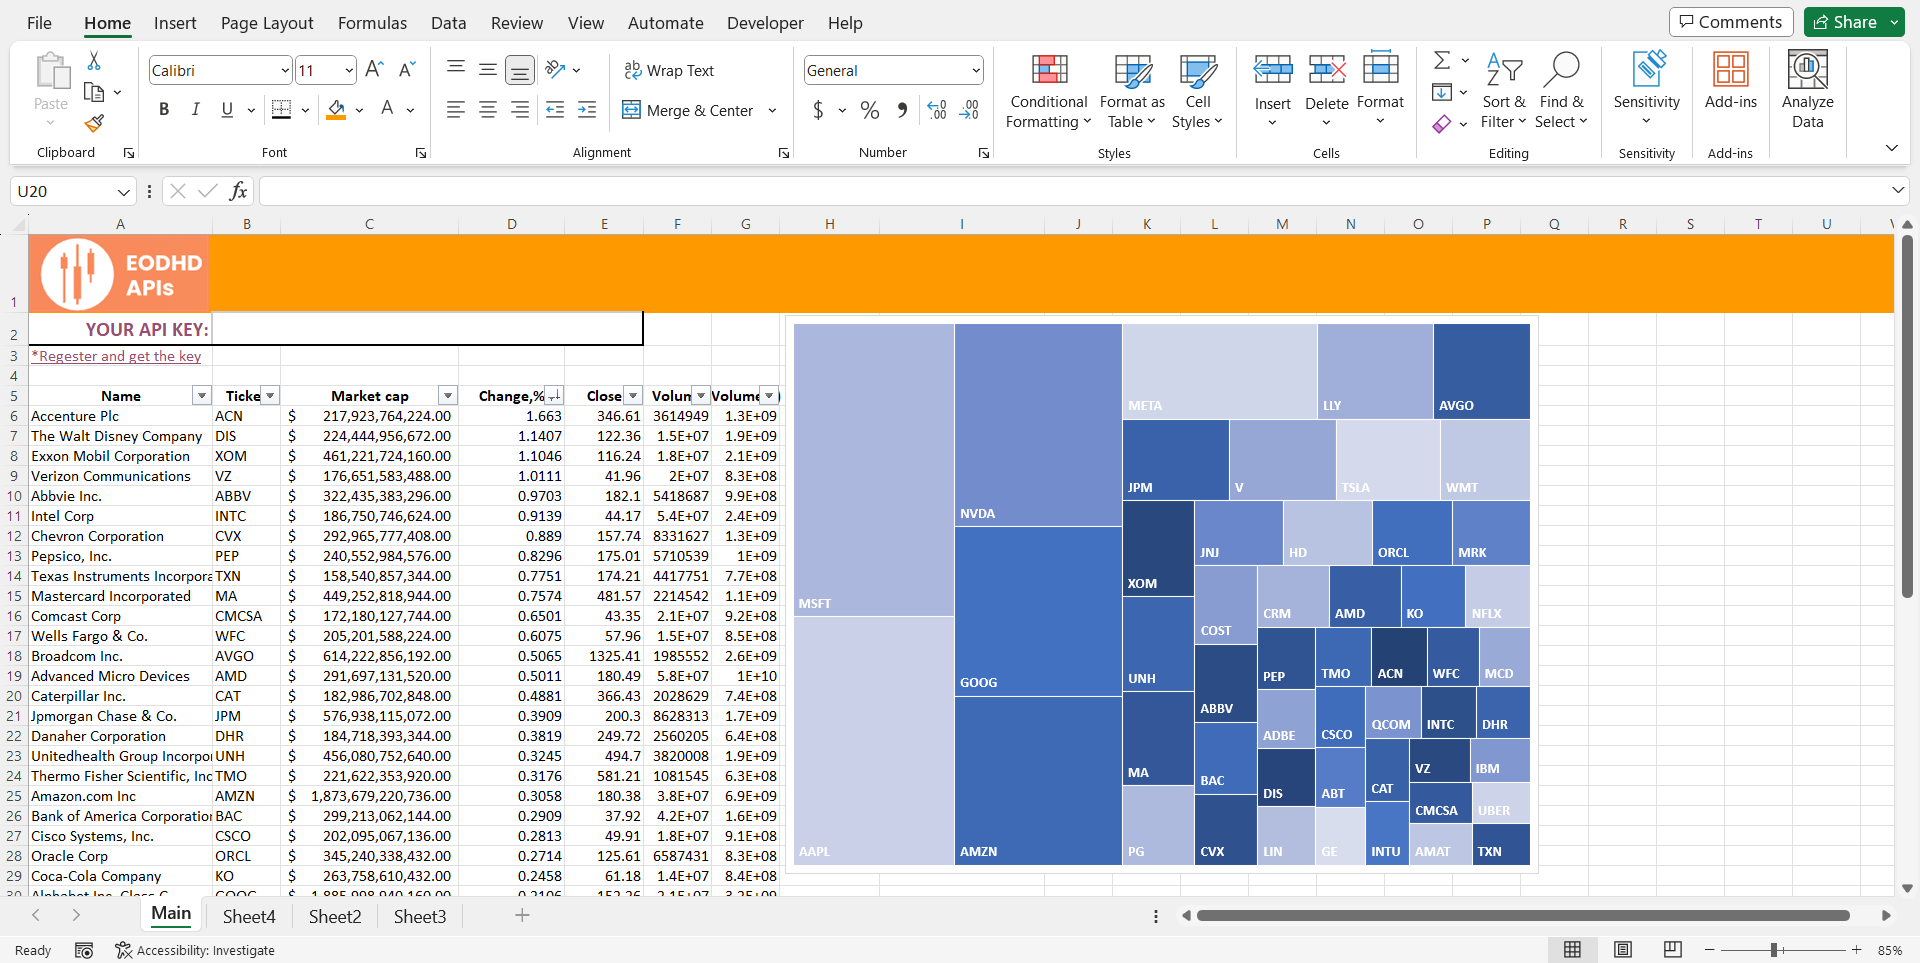
Creating a Treemap Chart in Excel
A treemap chart is the best way to visualize hierarchical data, allowing you to spot patterns and compare proportions. In a stock market context, it’s often used to show the relative market capitalizations of companies within a sector or index.
To create a treemap of the largest stocks in a market:
- Set up a table with 4 columns:
- Tickers: The stock symbols
- Market Cap: The market capitalization in dollars
- Change (%): The daily percent change
- To get the market cap, use the EODHD Fundamentals API with the filter parameter set to “Highlights::MarketCapitalization”:
=WEBSERVICE("https://eodhd.com/api/fundamentals/AAPL?api_token=YOUR_API_TOKEN&fmt=json&filter=Highlights::MarketCapitalization")
- For the daily percent change, use the Live API with “&filter=change_p”:
=VALUE(WEBSERVICE("https://eodhd.com/api/real-time/"&B50&"?api_token="&$B$2&"&fmt=json&&filter=change_p"))
Here, we used the function VALUE to extract values from the text data received from the API. Later the data will be used in charts.
- Select the data table and go to Insert > Charts > Treemap.
- Apply filter to the range(Since there is only a sequential gradient color rule for Treemap charts):
- Select filtered cells
- Home>Sort&Filter>Filter
- Sort by the change column, it’ll create a gradient color for the treemap based on the current stock price change.
- Customize the chart labels, colors, and styles as desired.
The result will be an interactive treemap showing the largest companies, sized by market cap and colored by their performance.
Sparklines, Charts, and Other Visualizations
To create charts from EODHD data:
- Import the data into a table using the WEBSERVICE function and the appropriate API endpoint (EOD, Intraday, Fundamentals, etc.) on a separate sheet.
- Select the data you want to chart
- Go to Insert > Charts and choose the desired chart type, or select a sparkline.
- Customize the chart title, axis labels, series names, and formatting
With the raw market data imported, you can create an assortment of charts and visualizations in Excel:
- Use Insert > Sparklines > line to generate inline price charts in individual cells
- Traded volume pie chart
- Histogram of the daily change in %
The EODHD API provides a wide variety of fundamental, event-driven, and sentiment data you can incorporate to build a rich, interactive dashboard.
Getting Started
Sign up for an EODHD API key to get started building your own best Excel trading dashboard today. Feel free to contact our support team at support@eodhistoricaldata.com for any questions or current discount offers. We’re happy to assist you through the process of leveraging EODHD’s data to elevate your investment workflow.
Great that you added graphs! Data visualization is always a plus.
I liked that everything is described step by step. This simplifies the process of creating a dashboard. Very useful for those who do not use complex programs for analysis.
The article is not bad, but there are too many technical details for beginners. They could explain it more simply.