

The Long-Short Equity Strategy has gained popularity among investors seeking to navigate market volatility and generate alpha. By taking long positions in stocks expected to outperform and short positions in those expected to underperform, this strategy aims to profit from both rising and falling markets. In this article, we will explore the intricacies of the Long-Short Equity Strategy, including its benefits, risks, and a practical example of how to implement and model the strategy using real-world stocks.
You can load our example Google Sheets spreadsheet to get access to analysis data.
The EODHD platform’s historical data for the AMZN and AAPL was used to assess the performance of the US market for the 1929-2023 period. The EODHD provides simple JSON APIs covering dividend payments, yields, ex-dates, and more for 150,000+ tickers across 70+ worldwide exchanges.
You can also check our template libraries with step-by-step guides for Excel and Google Sheets spreadsheets. Here you’ll find more information on our Ready-to-Go solutions.
Quick jump:
Understanding the Long-Short Equity Strategy
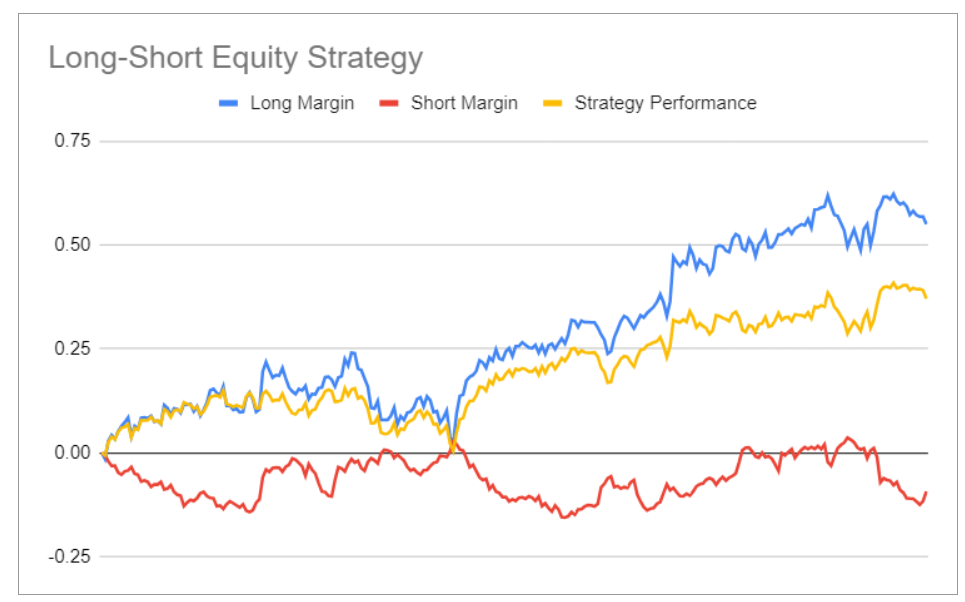
The Long-Short Equity Strategy involves simultaneously buying stocks that are expected to appreciate in value (long positions) and selling borrowed shares of stocks that are expected to decline in value (short positions). The goal is to profit from the relative performance difference between the long and short positions. By carefully selecting stocks based on fundamental analysis, market insights, and risk management techniques, investors aim to generate returns that outperform the broader market.
Benefits and Risks
The Long-Short Equity Strategy offers several advantages, such as the potential for alpha generation, hedging against market downturns, and diversification benefits. However, it also comes with risks, including market risk, short squeezes, regulatory risks, and the need for skilled managers to execute the strategy effectively. Investors must carefully consider their investment objectives, risk tolerance, and the intricacies of the strategy before implementation.
Example of using EODHD API
To illustrate the Long-Short Equity Strategy, let’s consider a hypothetical example using Amazon.com, Inc. (AMZN) and Apple Inc. (AAPL) over a one-year period from May 24, 2023, to May 24, 2024.
Our analysis suggests that Amazon may outperform due to its strong position in e-commerce, the growth potential of AWS, and the expansion of its streaming and advertising services. Conversely, we anticipate that Apple may underperform due to potential market saturation, increased competition, and regulatory challenges.
Investment Details:
- Initial Investment: $9,639.68
- Long Position: Buy 50 shares of AMZN at $116.75 per share (Total: $5,837.50)
- Short Position: Short sell 22 shares of AAPL at $171.84 per share (Total: $3,780.48)
To model the strategy’s performance, we can use Google Sheets with columns for Long-Short Pairs, Ticker, Start Date, End Date, Shares (pcs.), Purchase Price, and Sold Price. By inputting the initial prices and tracking the price changes over the one-year period, we can gain insights into the potential outcomes.
You can use IMPORTDATA() Google Sheets formula to access the data from the EODHD APIs, an example of the request for the End-of-Day data API is the following:
=IMPORTDATA("https://eodhd.com/api/eod/"&B8&"?api_token="&$B$2&"&fmt=csv&filter=adjusted_close&order=a&from="&TEXT(C8,"yyyy-mm-dd")&"&to="&TEXT(D8,"yyyy-mm-dd"))
Based on the data, by the end of the period the total portfolio value would be $12,524.30 ($9,052.50 from AMZN + $3,780.48 initial short sale proceeds – $330.88 loss from AAPL short position), representing a 29.92% return(Example of the spreadsheet).
This example demonstrates how to model the performance of a Long-Short Equity Strategy using Google Sheets, enabling investors to better understand the potential results of their investment decisions. It is important to note that the actual outcome may differ from this hypothetical example, and investors should conduct thorough research and consider their risk tolerance before implementing any investment strategy.
Long-Short Pair Ideas
Here are 5 more examples of pairs of stocks that could be considered for a Long-Short Equity Strategy.
- Long: Amazon.com, Inc. (AMZN) | Short: Macy’s, Inc. (M)
- Rationale: Growth of e-commerce vs. challenges faced by traditional brick-and-mortar retailers.
- Long: Tesla, Inc. (TSLA) | Short: Ford Motor Company (F)
- Rationale: Shift towards electric vehicles and Tesla’s market leadership vs. traditional automakers.
- Long: Nvidia Corporation (NVDA) | Short: Intel Corporation (INTC)
- Rationale: Growth in artificial intelligence and gaming vs. challenges in the traditional CPU market.
- Long: Netflix, Inc. (NFLX) | Short: AMC Entertainment Holdings, Inc. (AMC)
- Rationale: Streaming services’ dominance vs. challenges faced by traditional movie theaters.
- Long: PayPal Holdings, Inc. (PYPL) | Short: Western Union Company (WU)
- Rationale: Growth of digital payments vs. challenges faced by traditional money transfer services.
The main purpose of the Long-Short Equity Strategy in the examples provided is to isolate and capitalize on the relative performance between two stocks or sectors. By going long on a stock that is expected to outperform and simultaneously shorting a stock that is expected to underperform, investors aim to profit from the divergence in their performances, regardless of the overall market direction.
By isolating these specific performance drivers, investors can potentially generate returns that are less correlated to the broader market movements. This strategy aims to capitalize on the relative winners and losers within a specific theme or sector.
Conclusion
The Long-Short Equity Strategy offers investors a balanced approach to navigating market uncertainties and potentially generating alpha. By taking long positions in stocks expected to outperform and short positions in those expected to underperform, investors can profit from both rising and falling markets. However, implementing this strategy requires thorough research, risk management, and a solid understanding of financial markets.
Remember, the example provided is for illustrative purposes only and does not constitute investment advice. Before implementing any investment strategy, it is crucial to conduct your own research, consider your investment goals and risk tolerance, and consult with a financial professional.
Feel free to contact our support team at support@eodhistoricaldata.com for any questions or current discount offers. We’re happy to assist you through the process of leveraging EODHD’s data to elevate your investment workflow.