
Analyzing a company’s financial statements is essential for investors and finance professionals to assess corporate performance and health. While this process can be complex, Financial Statement Analysis in Google Sheets powered by dynamic EODHD APIs is much more efficient.
In this guide, we’ll walk through how to build a Google Sheets template that pulls key financial statement data from EODHD’s APIs, allowing you to analyze any public company’s financials. EODHD provides simple JSON APIs covering fundamentals, stock prices, and more for 150,000+ tickers across 70+ worldwide exchanges.
You can also check our template libraries with step-by-step guides for Excel and Google Sheets spreadsheets. Here you’ll find more information on our Ready-to-Go solutions.
Check our Financial Analysis Google Sheets Template to follow the article:
Financial Analysis Google Sheets Template
Quick jump:
Sign up for EODHD and get your API key
Register for a free EODHD account at https://eodhd.com/register to receive your API key. The free plan allows 20 API requests/day and 1 year of EOD historical data. Paid plans starting at $19.99/month enable more API calls and access to 30+ years of data.
To follow the article and test the basic functionality of our APIs you can use our “demo” key. The key gives you access to the Fundamentals and Historical data for AAPL, TSLA, MSFT, and MCD tickers.
Pull in data from EODHD to Google Sheets
The main tool to retrieve data into the spreadsheet cell from an API is a “=IMPORTDATA()” Google Sheets formula. By using the formula you can get access to all our Fundamental And Historical APIs. Thus, It is important to check the official Google Sheets Documentation.
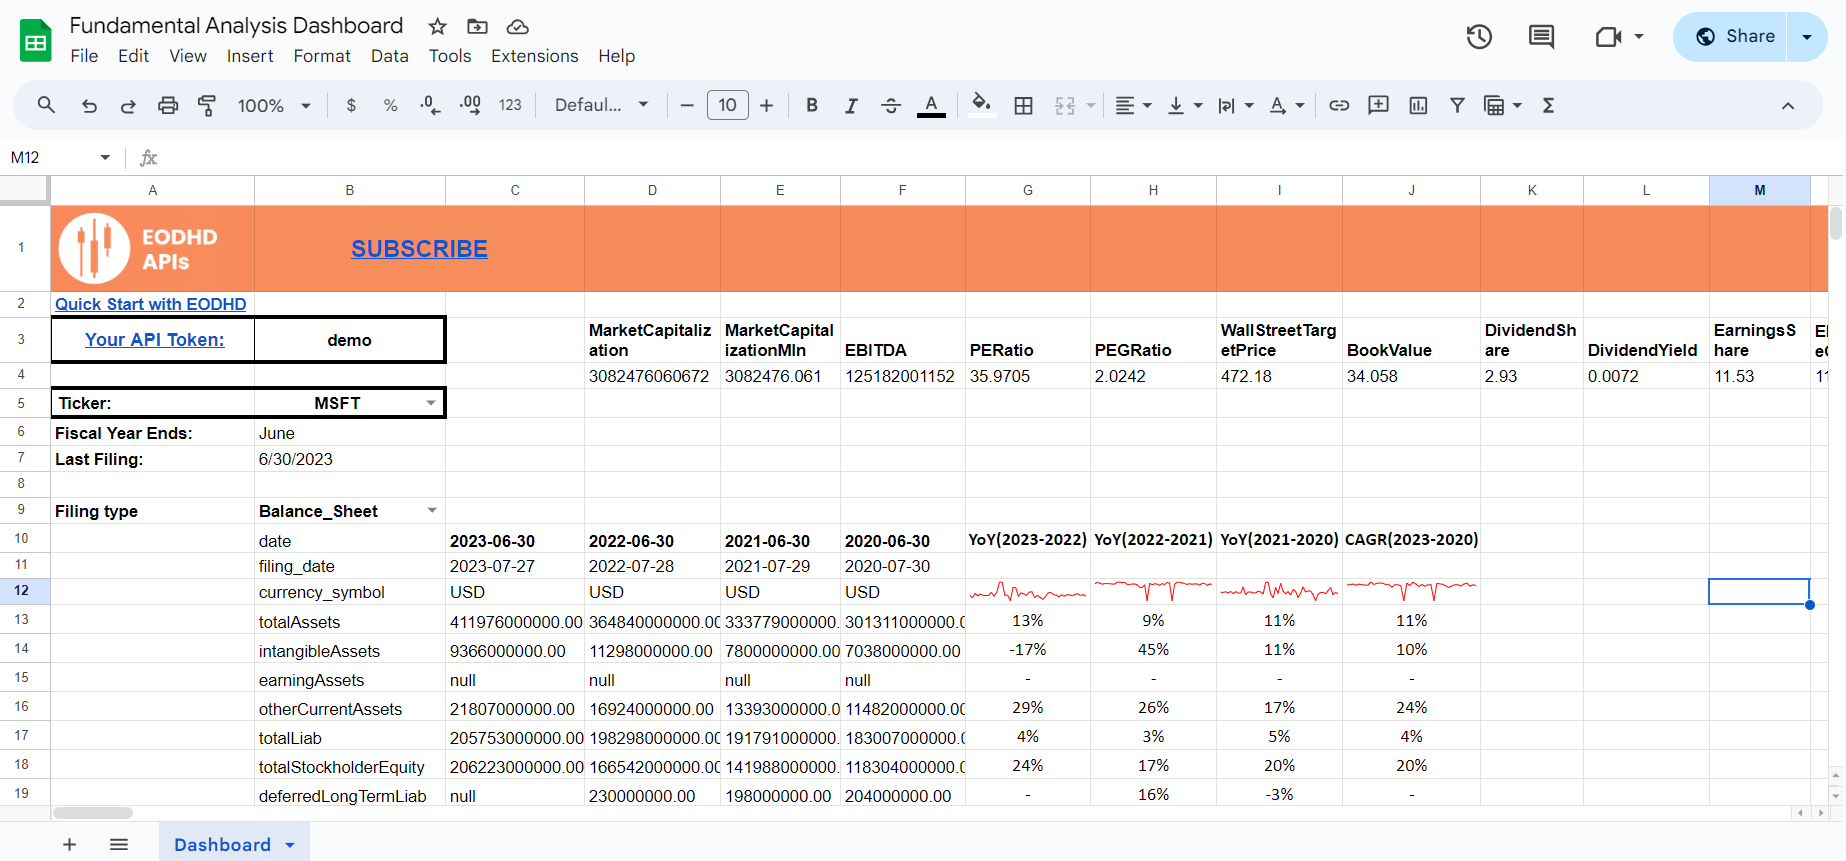
Use the Fundamentals API to retrieve the financial statement figures for your chosen stock:
=ARRAYFORMULA(SUBSTITUTE(ARRAYFORMULA(SUBSTITUTE(ARRAYFORMULA(SUBSTITUTE(INDEX(SPLIT(TRANSPOSE(IMPORTDATA("https://eodhd.com/api/fundamentals/"&$B$5&"?api_token="&$B$3&"&filter=Financials::"&$B$9&"::yearly::"&TEXT($B$7,"YYYY-MM-DD"))), ":"),,2), """", "")),"}","")),"{",""))
Here’s how it works step by step:
- TEXT($B$7,”YYYY-MM-DD”): This part formats the date in the cell $B$7 as “YYYY-MM-DD”. This formatted date is then used in the API request.
- “https://eodhd.com/api/fundamentals/”&$B$5&”?api_token=”&$B$3&”&filter=Financials::”&$B$9&”::yearly::”&TEXT($B$7,”YYYY-MM-DD”): This part constructs the URL for the Fundamentals API request. It concatenates various parameters:
- $B$5 contains the ticker symbol.
- $B$3 contains an API key. To get full access please subscribe to one of EODHD’s monthly plans.
- $B$9 contains the type of financial statement (Balance Sheet, Income Statement, Cash Flow).
- TEXT($B$7,”YYYY-MM-DD”) provides the date of filing.
- IMPORTDATA: This function retrieves data from the specified URL.
- TRANSPOSE: This function transposes the imported data, making it easier to manipulate.
- SPLIT: This function splits the transposed data into columns based on the colon “:” delimiter.
- INDEX(…,,2): This function indexes only the second column of the split data, extracting the values. For the names of raws, you need to use the first column.
- SUBSTITUTE: This function removes any quotes (“) from the extracted values, making them clean.
- ARRAYFORMULA: This function enables the use of array operations, allowing the formula to apply operations to entire ranges of data.
- The formula repeats the SUBSTITUTE operation multiple times (three times in total) to ensure all quotes are removed. The formula removes any remaining curly braces {} and ” using SUBSTITUTE.
Add Ratios
There are several ways to calculate ratios or metrics to show the trend in financial statements over the period.
Year-over-Year (YoY) Growth Rate: Calculate the percentage change in earnings from one year to the next. For example:
2023 vs 2022: (27195000000 - 24512000000) / 24512000000 = 10.95%
Then duplicate the formula over the number of periods required. The template has 4 years, you can monitor the change over longer periods depending on your analysis time horizon.
Compound Annual Growth Rate (CAGR): Calculate the average annual growth rate over the entire period. For example:
CAGR = (Ending Value / Beginning Value)^(1 / Number of Years) - 1 CAGR = (27195000000 / 19269000000)^(1 / 3) - 1 = 12.19%
These ratios help demonstrate the trend in financials over the period. The YoY Growth Rate shows the year-to-year changes, the CAGR represents the average annual growth rate.
To pull in the current recalculated ratios from the Fundamentals API, use the following cell formula with the Fundamental API call and the “Highlights” filter field:
=TRANSPOSE(ARRAYFORMULA(SUBSTITUTE(ARRAYFORMULA(SUBSTITUTE(ARRAYFORMULA(SUBSTITUTE(INDEX(SPLIT(TRANSPOSE(IMPORTDATA("https://eodhd.com/api/fundamentals/"&$B$5&"?api_token="&$B$3&"&filter=Highlights")), ":"),,2), """", "")),"}","")),"{","")))
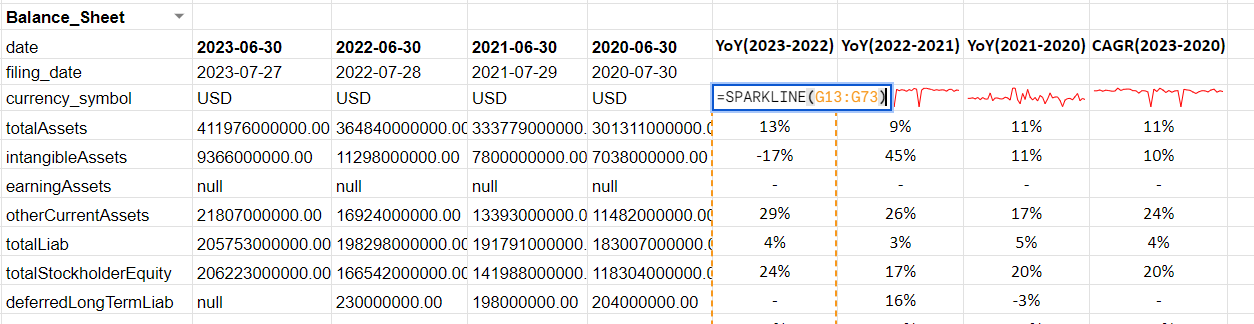
Add sparkline cell charts
Utilizing sparklines in fundamental analysis provides valuable insights into the fluctuations within filings. It’s crucial to delve deeper into the values that have experienced significant changes over the specified period. An example of cell formula:
=SPARKLINE(G13:G73)
Conclusion
With this template powered by EODHD’s APIs, you can quickly access and analyze the financials for any stock to uncover crucial insights. The EODHD platform offers:
- Worldwide coverage: 150,000+ stocks, 20,000+ ETFs, 1000+ indices across 70+ exchanges
- Deep history: 30+ years of fundamentals and EOD pricing data
- Google Sheets-friendly: Simple APIs that work seamlessly with the IMPORTDATA()
- Low cost: Plans from $19.99/month
EODHD’s financial data APIs combined with Google Sheets’ analysis capabilities provide a powerful yet accessible toolset for in-depth financial statement analysis. This templated approach streamlines the data gathering to let you focus on uncovering actionable insights to drive better investment decisions.
Feel free to contact our support team at support@eodhistoricaldata.com for any questions or current discount offers. We’re happy to assist you through the process of leveraging EODHD’s data to elevate your investment workflow.