

Backtesting Technical Analysis Strategies is an essential process for evaluating the effectiveness of a trading strategy before deploying it in live markets. By using historical data, you can simulate the performance of your strategies and assess risk and potential returns. In this article, we’ll walk through how to build an Excel template that pulls key financial statement data from EODHD’s APIs using cell formulas, allowing you to analyze any public company’s financials.
EODHD provides simple JSON APIs covering fundamentals, stock prices, and more for 150,000+ tickers across 70+ worldwide exchanges.
You can also check our guides for Excel Stock Portfolio Tracker and Market Dashboard. Here you’ll find more information on our Ready-to-Go solutions.
Download our Backtesting Tool Template to follow the article:
Quick jump:
Sign up for EODHD and get your API key
Register for a free EODHD account at https://eodhd.com/register to receive your API key. The free plan allows 20 API requests/day and 1 year of EOD historical data. Paid plans starting at $19.99/month enable more API calls and access to 30+ years of data.
To follow the article and test the basic functionality of our APIs you can use our “demo” key. The key gives you access to the Fundamentals and Historical data for AAPL, TSLA, MSFT, and MCD tickers.
Pull in data from EODHD API
The main tool to retrieve data into the spreadsheet cell from an API is a “=WEBSERVICE()” Excel formula. By using the formula you can get access to all our Fundamental And Historical APIs. Thus, It is important to check the official documentation from Microsoft.
Backtesting Technical Analysis Strategies Requires price time series. Use the End-of-Day API to retrieve the EOD OHLC data for your chosen stock:
=LET(raw_data,WEBSERVICE("https://eodhd.com/api/eod/"&$C$3&"?api_token="&$B$2&"&order=a&fmt=json&from="&TEXT($C$4,"YYYY-MM-DD")&"&to="&TEXT($C$5,"YYYY-MM-DD")&"&filter="&C11),
filtered_data,FILTERXML("<t><s>"&SUBSTITUTE(MID(raw_data,2,LEN(raw_data)-2),",","</s><s>")&"</s></t>","//s"),
VALUE(SUBSTITUTE(filtered_data,"""","")))
The formula’s WEBSERVICE Function sends a web request to the EODHD’s End-of-Day data API and retrieves the data from it. Where $B$2 is an API token, $C$3 is a ticker symbol,$C$4 and $C$5 is a date range, and C11 is a filter (date, open, high, low, close). LET Function is used to define variables within a formula. raw_data stores the raw data fetched from the web service. filtered_data uses FILTERXML to parse XML content and returns the data based on an XPath query. VALUE Function converts text into the number format. The SUBSTITUTE Function is used to clean up the format before converting it into numerical values.
Defining the Technical Analysis Strategy
Next, define the technical analysis strategy you wish to backtest. For this example, we will use three commonly used technical analysis strategies: the Simple Moving Average (SMA) crossover, the Relative Strength Index (RSI) Strategy, and the Moving Average Convergence Divergence (MACD) Crossover Strategy.
Simple moving average (SMA) crossover strategy
SMA crossover strategy is defined in the following way:
- Buy signal: When the 50-day simple moving average (SMA) crosses above the 200-day SMA.
- Sell signal: When the 50-day SMA crosses below the 200-day SMA.
For the strategy to work, we need to calculate 50 and 200-day SMA for the price time series To get SMA for the period we could use the Excel’s “=AVERAGE(range)” cell formula.
For an SMA indicator, you can also use EODHD’s Technical API, the cell function will look like this:
=LET(raw_data,WEBSERVICE("https://eodhd.com/api/technical/AAPL.US?order=d&from=2017-08-01&to=2020-01-01&function=sma&period=50&api_token=demo&fmt=json"),
filtered_data,FILTERXML("<t><s>"&SUBSTITUTE(MID(raw_data,2,LEN(raw_data)-2),",","</s><s>")&"</s></t>","//s"),
SUBSTITUTE(filtered_data,"""",""))
Relative Strength Index (RSI) Strategy
RSI strategies could be explained as:
- Buy signal: When the RSI crosses above 30 (oversold threshold)
- Sell signal: When the RSI crosses below 70 (overbought threshold)
The formula for RSI is defined as:
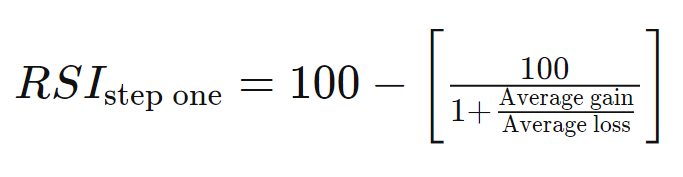
An Excel cell function for the formula would look like the following:
=LET(
period, 14,
    prices, F12:F110,
    changes, prices - INDEX(prices,1),
    gains, IF(changes > 0, changes, 0),
    losses, IF(changes < 0, ABS(changes), 0),
    avg_gain, AVERAGE(IF(ROW(prices) > (ROW(prices)-period), gains)),
    avg_loss, AVERAGE(IF(ROW(prices) > (ROW(prices)-period), losses)),
    rs, IF(avg_loss = 0, 0, avg_gain / avg_loss),
    100 - (100 / (1 + rs)))
This formula calculates the SMAs and generates buy and sell signals based on the crossover strategy using the price data in the range F9:F825.
Moving Average Convergence Divergence (MACD) Crossover Strategy
MACD crossover strategy is:
- Buy signal: When the MACD line crosses above the signal line
- Sell signal: When the MACD line crosses below the signal line
For MACD and MACD(signal) values, we need to calculate EMA12 and EMA26. Formulas for MACD are the following:
MACD=EMA12(close)-EMA26(close)
MACDsignal=EMA9(MACD)
The formula for EMA:
EMA=PriviousEMA+(1/period+1)*(close-PriviousEMA)
For the first PriviousEMA, we use AVERAGE(previous range).
For an SEMA indicator, you can also use EODHD’s Technical API, the cell function will look like this:
=LET(raw_data,WEBSERVICE("https://eodhd.com/api/technical/AAPL.US?order=d&from=2017-08-01&to=2020-01-01&function=ema&period=50&api_token=demo&fmt=json"),
filtered_data,FILTERXML("<t><s>"&SUBSTITUTE(MID(raw_data,2,LEN(raw_data)-2),",","</s><s>")&"</s></t>","//s"),
SUBSTITUTE(filtered_data,"""",""))
The cell function will return the list of EMA values. To get access to the technical API you need to register and use your API key.
Generating Trading Signals and Trades
Create a new column in your spreadsheet to generate trading signals based on the defined strategies. Use Excel’s IF function to check whether the signal criterion is meat for the specific strategy.
An example of the crossover cell formula:
=IF(AND((L215-M215)>0,(L216-M216)<0),-F216,IF(AND((L215-M215)<0,(L216-M216)>0),F216,))
Formula meeting RSI criterion:
=IF(AND(I216>30,I215<30),F216,IF(AND(I215<70,I216>70),-F216,))
The formulas above will result in trades SELL or Buy depending on the criterion of the strategy. The sum of all trades per strategy provides us with the total return of a specific strategy.

Conclusion
Backtesting Technical Analysis Strategies is a crucial step in evaluating the potential of a specific path. By leveraging EODHD’s API and Excel, traders can efficiently retrieve historical data, simulate trades, and analyze the performance of their technical analysis-based strategies. However, it is essential to remember that past performance does not guarantee future results. Traders should use backtesting as one of many tools in their decision-making process and always consider the limitations and assumptions involved in the backtesting process.