

In the dynamic world of finance, the ability to predict stock market trends is a coveted skill. With the advent of technology and the rise of data science, we now have tools at our disposal that can help us analyze and predict these trends with a higher degree of accuracy. One such tool is Python, a versatile programming language widely used in the field of data science. Coupled with End of Day Historical Data (EODHD) APIs, Python can be a powerful ally in financial data analysis.
The importance of news in influencing stock performance cannot be overstated. News events can cause significant fluctuations in stock prices. By analyzing the sentiment of news articles, we can gain insights into potential impacts on stock performance. This article will delve into how we can use Python and EODHD APIs to analyze the impact of news on stock performance.
Quick jump:
In this article, we will cover:
- Python and EODHD APIs: We will discuss the basics of Python and EODHD APIs, their importance in financial data analysis, and how to use them.
- News Sentiment Analysis: We will explore the concept of news sentiment analysis, its relevance in stock market predictions, and how to perform it using Python.
- Case Study: We will walk through a real-world example where we use Python and EODHD APIs to analyze the impact of news on a specific stock’s performance.
- Best Practices: We will discuss some of the best practices to follow when performing financial data analysis using Python and EODHD APIs.
Python and EODHD APIs: A Powerful Combo
Python is a high-level, interpreted programming language known for its simplicity and readability. Its extensive library support makes it a popular choice for various applications, including web development, machine learning, artificial intelligence, and, most importantly for us, financial data analysis.
EODHD, on the other hand, provides APIs that offer access to a wealth of financial data. From stock prices and trading volumes to company fundamentals and market news, EODHD APIs provide a comprehensive dataset for financial analysis.
By combining Python’s data processing capabilities with the rich data provided by EODHD APIs, we can perform complex financial analyses with relative ease. For instance, we can fetch historical stock data using EODHD APIs, process and analyze the data using Python, and then use the insights gained to make informed investment decisions.
Let’s take a look at a simple Python code snippet that fetches historical stock data using EODHD APIs:
import requests

def fetch_stock_data(symbol):
    api_url = f"https://eodhistoricaldata.com/api/eod/{symbol}"
    api_key = "YOUR_API_KEY"
    params = {
        "api_token": api_key,
        "fmt": "json"
    }
    response = requests.get(api_url, params=params)
    data = response.json()
    return data

# Fetch data for Apple Inc.
data = fetch_stock_data("AAPL.US")
print(data)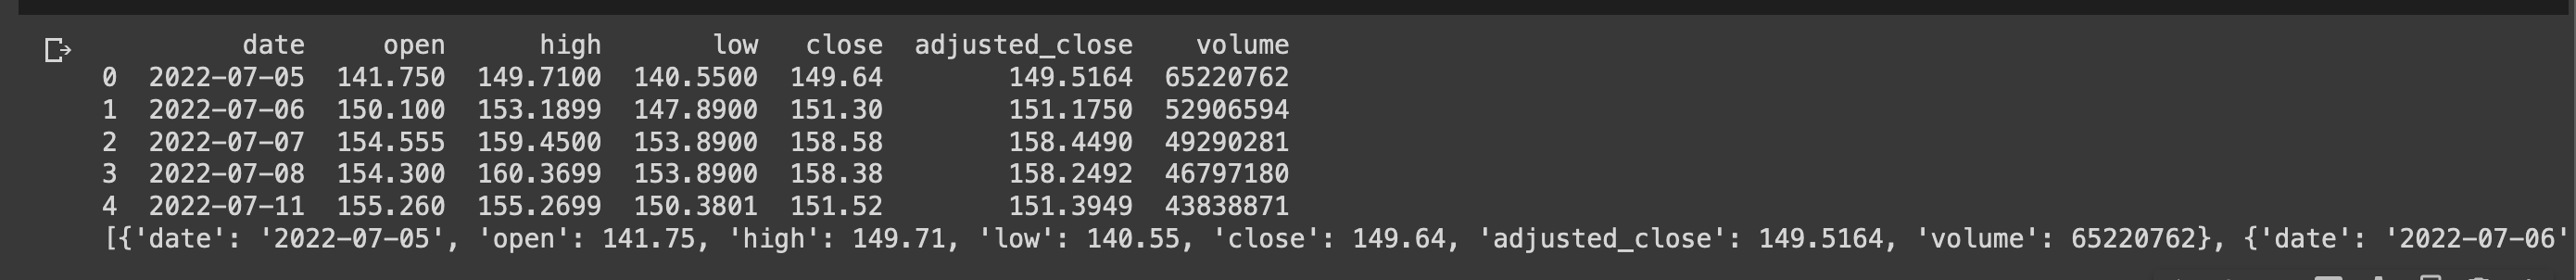
In this code snippet, we define a function fetch_stock_data that takes a stock symbol as input and fetches the corresponding historical stock data using the EODHD API. We then call this function with the symbol for Apple Inc. (“AAPL.US”) and print the fetched data.
This is just a simple example. With Python and EODHD APIs, we can perform much more complex analyses, such as analyzing the impact of news on stock performance, which we will discuss in the next section.
News Sentiment Analysis
News sentiment analysis is a technique used to determine the sentiment expressed in news articles. It can be a powerful tool for predicting stock performance as it provides insights into the public sentiment towards a particular stock. By analyzing the sentiment of news articles, we can potentially predict whether a stock’s price will go up (positive sentiment) or down (negative sentiment).
One way to perform news sentiment analysis is by using Natural Language Processing (NLP), a field of AI that deals with the interaction between computers and humans through language. Python, with its extensive library support, is an excellent tool for performing NLP tasks.
A popular Python library for NLP is NLTK (Natural Language Toolkit). It provides easy-to-use interfaces to over 50 corpora and lexical resources such as WordNet, along with a suite of text processing libraries for classification, tokenization, stemming, tagging, parsing, and semantic reasoning.
Let’s take a look at a Python code snippet that performs sentiment analysis on a news headline:
from nltk.sentiment.vader import SentimentIntensityAnalyzer

def analyze_sentiment(headline):
    sia = SentimentIntensityAnalyzer()
    sentiment = sia.polarity_scores(headline)
    return sentiment

# Analyze sentiment of a news headline
headline = "Nvidia reports record-breaking quarterly earnings"
sentiment = analyze_sentiment(headline)
print(sentiment)
In this code snippet, we define a function analyze_sentiment that takes a news headline as input and returns the sentiment of the headline. We use the SentimentIntensityAnalyzer class from the nltk.sentiment.vader module to perform the sentiment analysis. We then call this function with a sample news headline and print the sentiment.
This is a simple example of how we can use Python to perform news sentiment analysis. In the next section, we will discuss how we can use this technique, along with the data fetched using EODHD APIs, to analyze the impact of news on stock performance.
Analyzing the Impact of News on Stock Performance
Analyzing the impact of news on stock performance involves correlating the sentiment of news articles with the corresponding stock price movements. This can be a complex task as it involves dealing with large amounts of data and requires a good understanding of both financial analysis and data science.
However, with Python and EODHD APIs, we can simplify this task to a great extent. We can fetch the historical stock data using EODHD APIs, perform news sentiment analysis using Python, and then correlate the two to analyze the impact of news on stock performance.
Let’s take a look at a Python code snippet that performs this analysis:
import pandas as pd
import matplotlib.pyplot as plt

def analyze_impact(stock_data, news_data):
    # Merge stock data and news data on date
    data = pd.merge(stock_data, news_data, on="date")

    # Calculate correlation between stock price and news sentiment
    correlation = data["price"].corr(data["sentiment"])

    # Plot stock price and news sentiment
    fig, ax1 = plt.subplots()
    ax2 = ax1.twinx()
    ax1.plot(data["date"], data["price"], color="blue")
    ax2.plot(data["date"], data["sentiment"], color="red")
    plt.show()

    return correlation

# Analyze impact of news on stock performance
correlation = analyze_impact(stock_data, news_data)
print(correlation)
In this code snippet, we define a function analyze_impact that takes historical stock data and news sentiment data as input and returns the correlation between the stock price and the news sentiment. We use the merge function from the pandas library to merge the stock data and news sentiment data on the date. We then calculate the correlation between the stock price and the news sentiment using the corr function from the pandas library. Finally, we plot the stock price and the news sentiment against the date using the matplotlib library.
This is a simple example of how we can use Python and EODHD APIs to analyze the impact of news on stock performance. However, in a real-world scenario, the analysis would be much more complex and would involve dealing with a large amount of data.
Best Practices
As a senior data scientist who has extensive experience with financial data, I would like to share some best practices that you should follow when performing financial data analysis using Python and EODHD APIs:
- Data Quality: Always ensure the quality of your data. The quality of your analysis is only as good as the quality of your data. Always check your data for errors and inconsistencies and clean your data before performing any analysis.
- Understand Your Data: Before performing any analysis, make sure you understand your data. Know what each column in your data represents and understand the relationships between different columns.
- Use the Right Tools: Python has a wide range of libraries for data analysis. Make sure you use the right library for the task at hand. For instance, use
pandasfor data manipulation,matplotlibfor data visualization, andnltkfor natural language processing. - Keep Your Code Organized: Keep your code organized and well-documented. Use comments to explain what your code does and use meaningful variable names. This will make your code easier to understand and maintain.
- Stay Up-to-Date: The field of data science is constantly evolving. Always stay up-to-date with the latest tools and techniques in data science.
By following these best practices, you can ensure that your financial data analysis is accurate, efficient, and effective.
Conclusion
In this article, we discussed how we can use Python and EODHD APIs to analyze the impact of news on stock performance. We started by discussing the basics of Python and EODHD APIs and their importance in financial data analysis and then explored the concept of news sentiment analysis and how to perform it using Python. We also walked through a real-world example where we used Python and EODHD APIs to analyze the impact of news on a specific stock’s performance. Finally, we discussed some of the best practices to follow when performing financial data analysis using Python and EODHD APIs.
By combining the power of Python and EODHD APIs, we can perform complex financial analyses with relative ease. Whether you’re a seasoned financial analyst or a budding data scientist, these tools can help you gain valuable insights into the stock market and make informed investment decisions.
My Advice
As a senior data scientist, my advice to you would be to always keep learning. The field of data science is constantly evolving, and there’s always something new to learn. Whether it’s a new Python library, a new data analysis technique, or a new API, always be on the lookout for ways to improve your skills and knowledge.
Also, don’t be afraid to experiment. The best way to learn is by doing. Try out different analysis techniques, play around with different Python libraries, and don’t be afraid to make mistakes. That’s how you learn and grow.
Finally, always remember the importance of communication. As a data scientist, your job is not just to analyze data, but also to communicate your findings to others. Whether you’re presenting your analysis to a team of data scientists or explaining your findings to a non-technical audience, always strive to communicate clearly and effectively.
I hope you found this article informative and helpful. Happy analyzing!