Important! Since we have introduced a new version of the R library for EODHD functions, the current library is no longer supported on CRAN and has been replaced by the new library (eodhdR2). The current library is still available via our GitHub.
R is an open-source programming language that has gained immense popularity in the data science community for its robust statistical capabilities and visualization tools. Whether you’re a budding data analyst or a professional trader, EODHD’s R library provides a versatile environment for handling vast financial data, creating visualizations, and conducting sophisticated analyses.
In this quick guide, we will show you how to install the library and use its most popular functions.
Quick jump:
Installation and examples
First things first, ensure you have R and RStudio installed on your machine. RStudio is an integrated development environment (IDE) that makes working with R more convinient. You can download R from CRAN and RStudio from RStudio’s official website. Following guide will be based on RStudio.
Required Environment:
- R version from 4.3.1 to latest
- R Studio
Feel free to visit our Github page to subscribe to receive notifications about future updates for R library.
R library installation process
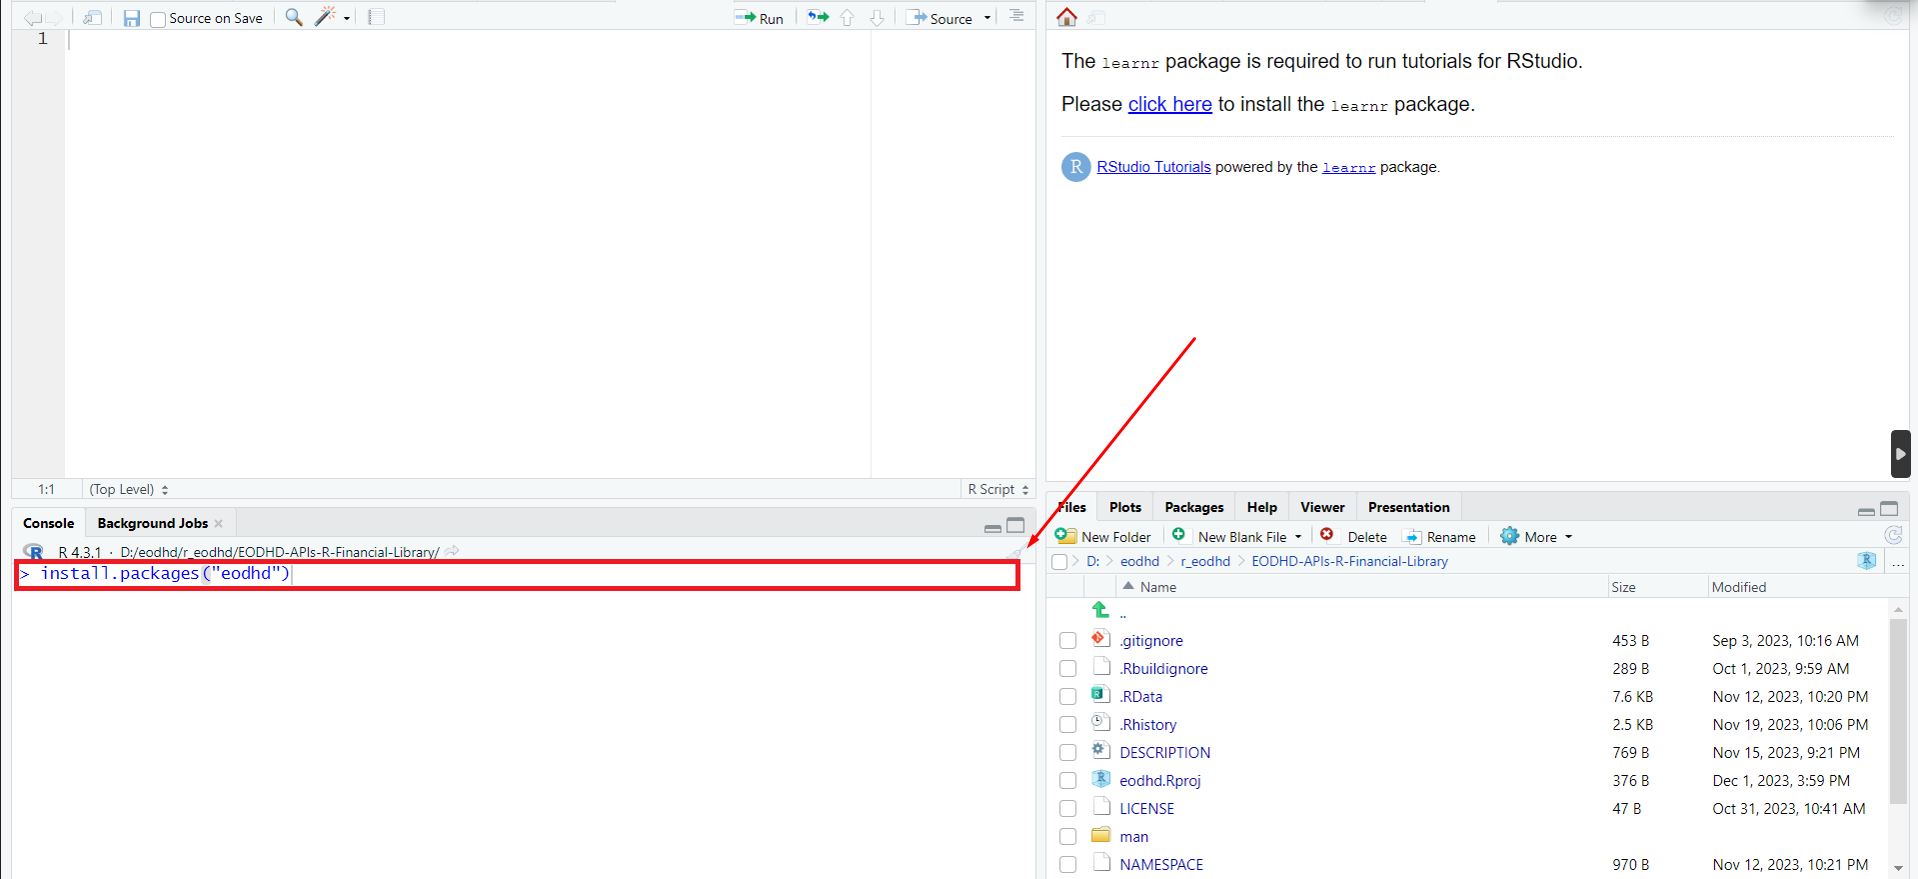
1. Installing the library. Type the following command and hit Enter:
install.packages("eodhd")See the screenshot:
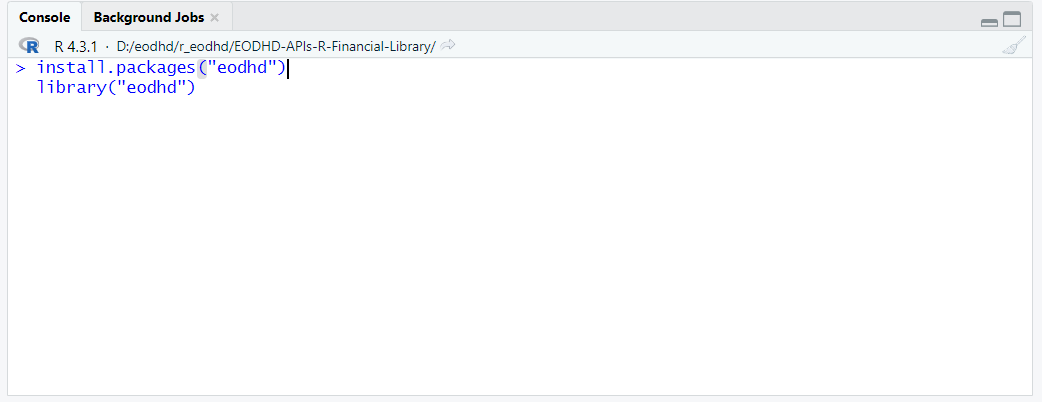
2. Library Import. Next, let’s import EODHD library for accessing EODHD API’s functions:
library("eodhd")See the screenshot:
R Financial Library is installed now. Next, we are going to activate EODHD’s API key to get an access to data.
API access activation: free and payed options
1. You can start with “DEMO” API key to test the data for a few tickers only: AAPL.US, TSLA.US , VTI.US, AMZN.US, BTC-USD and EUR-USD. For these tickers, all of our APIs, including Real-Time Data, are availible without limitations.
2. Register for the free plan to receive your API key (limited to 20 API calls per day) with access to End-Of-Day Historical Stock Market Data API for any ticker, but within the past year only. Plus a List of tickers per Exchange is availible.
3. We recommend exploring our plans, starting from $19.99, to access the necessary type of API without limitations.
Once you have EODHD API key, you can set it in an additional file, for example “key.R”:
api_key <- 'demo'To implement the “key.R” file in your code:
source("key.R")
print(api_key)
Or set the type as an argument for the function:
api_token='demo'Having implemented an active API key, we are ready to call for data.
Information about a function
To access all information about a specific function, you can use the help command:
help(get_eod_historical_stock_market_data)See the example:
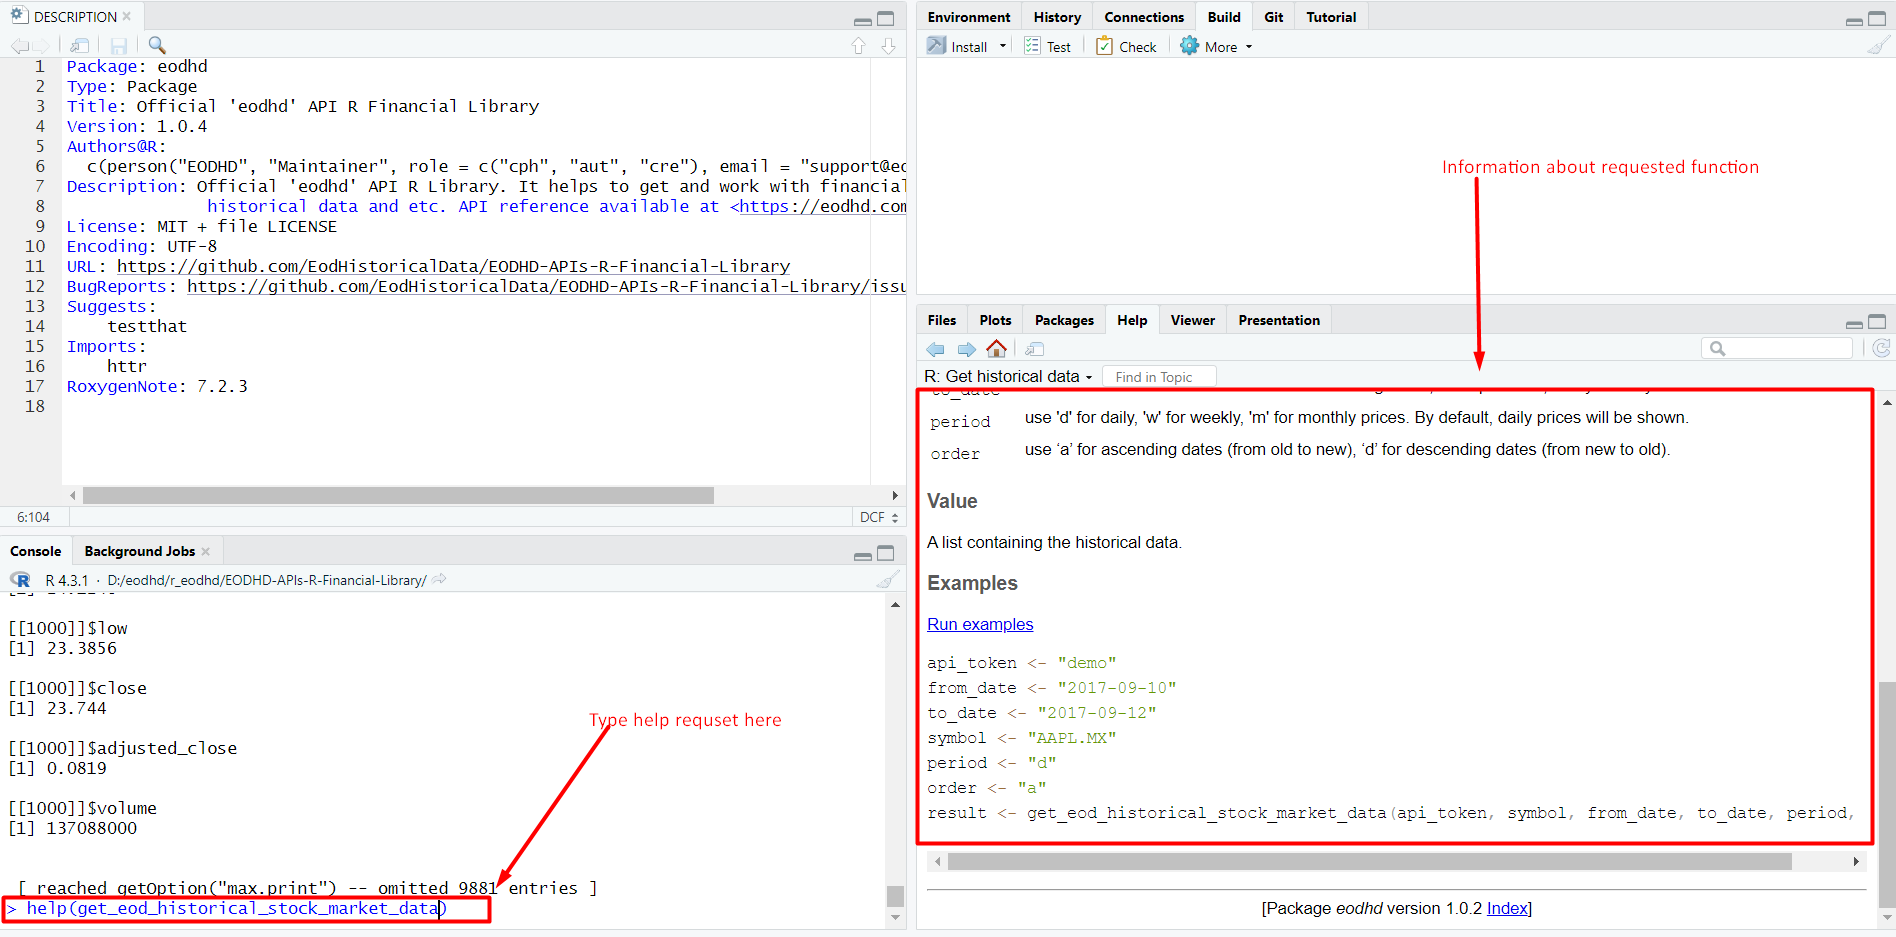
Scroll down to the end of this guide to see all availible functions.
Example: End of the day historical stock market data
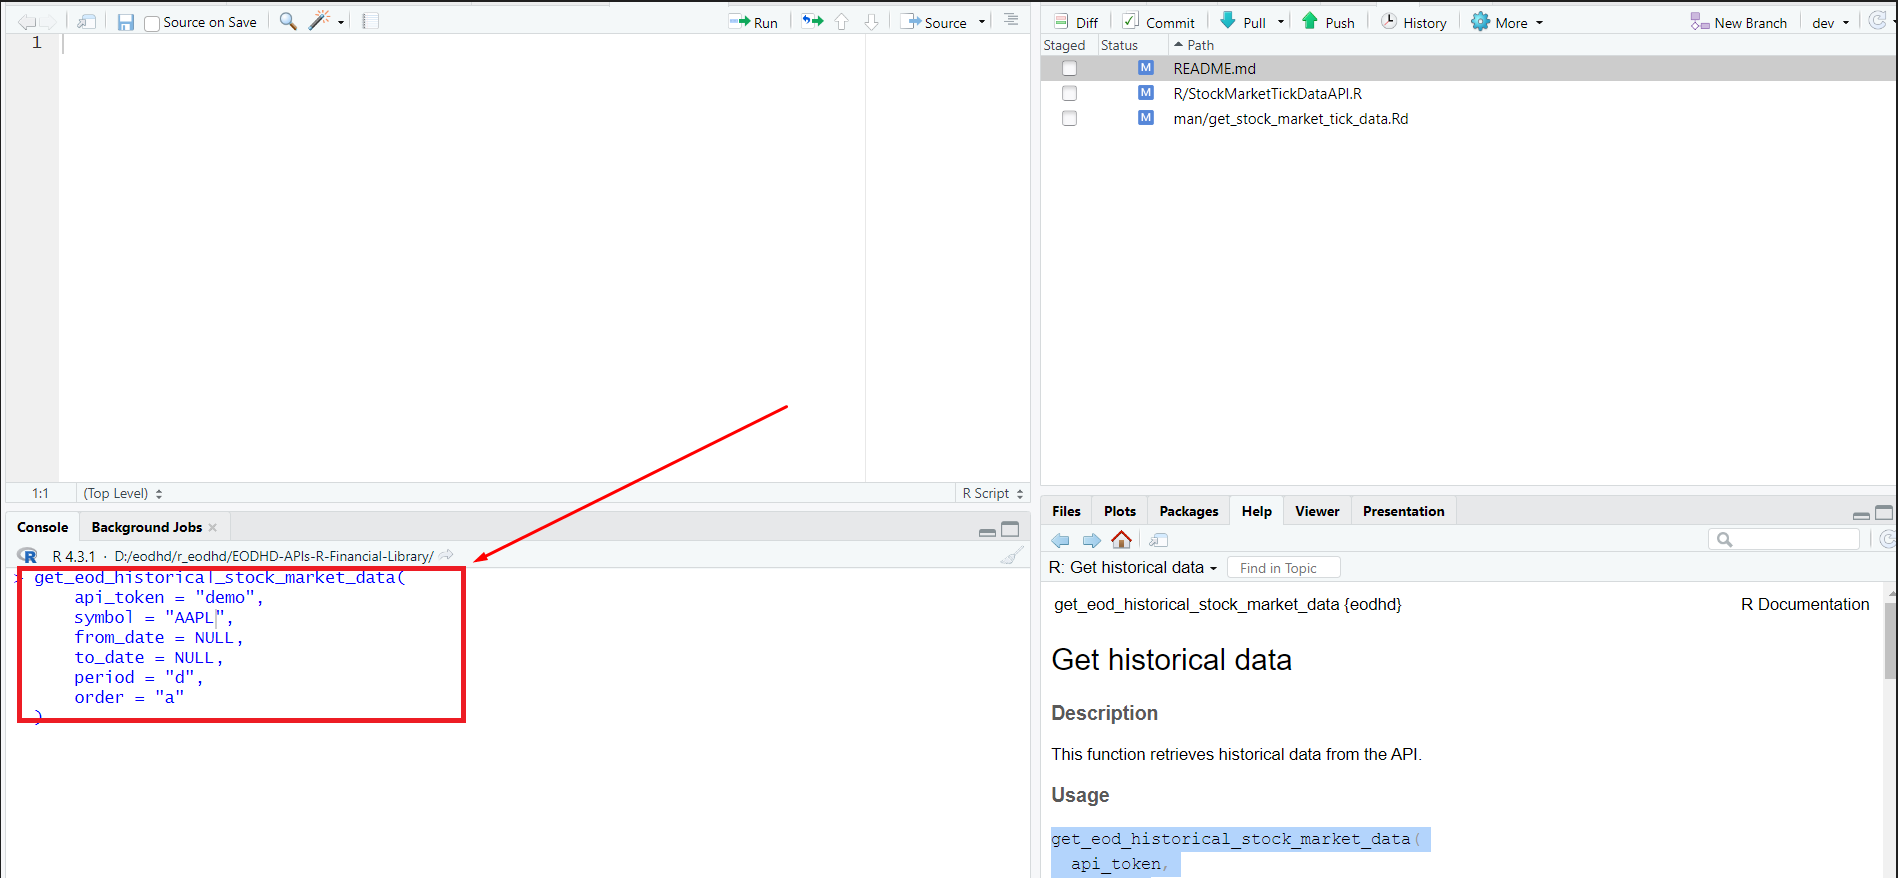
Lets call for End of the day historical stock market data:
get_eod_historical_stock_market_data(
    api_token = "demo",
    symbol = "AAPL",
    from_date = NULL,
    to_date = NULL,
    period = "d",
    order = "a"
)
See the example:
The function will return the following JSON respond:
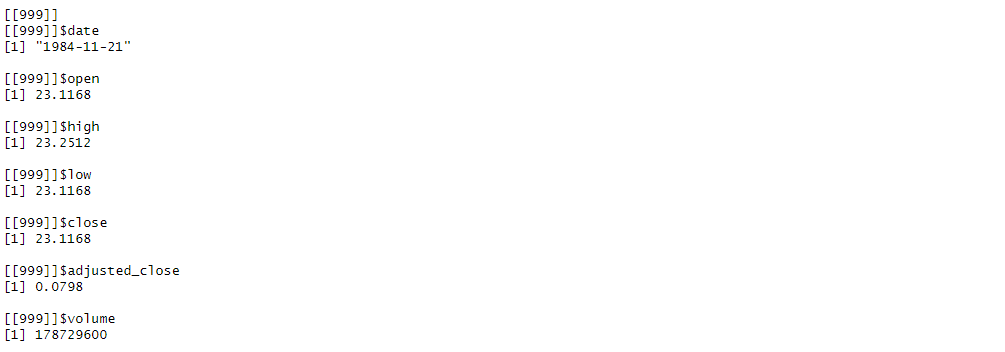
All the parameters for this function are listed and described here.
List of the available functions
Below is the list of functions to retrieve various data, including code examples and links to documentation containing descriptions of all parameters:
| Function & description | Code examples |
|---|---|
| Live (Delayed) Stock Prices and Macroeconomic Data (doc) | |
| Bonds Fundamentals (doc) | |
| Intraday Historical Data (doc) | |
| Historical Dividends (doc) | |
| Historical Splits (doc) | |
| Bulk API for EOD, Splits and Dividends (doc) | |
| Calendar. Upcoming Earnings, Trends, IPOs and Splits (doc) |
|
| Economic Events (doc) | |
| Stock Market and Financial News (doc) | |
| End of the Day Historical Stock Market Data (doc) | |
| List of supported Exchanges (doc) | |
| Insider Transactions (doc) | |
| Macro Indicators (doc) | |
| Exchanges API. Trading Hours, Stock Market Holidays, Symbols Change History (doc) |
|
| Stock Market Screener (doc) | |
| Technical Indicator (doc) | |
| Historical Market Capitalization (doc) | |
| Fundamental Data: Stocks, ETFs, Mutual Funds, Indices and Cryptocurrencies (doc) | |
Direct EODHD request call in R enviroment
In the following example, we use direct EODHD API request without pre-installed library and it’s functions. Plus this time, we request result as .csv file.
api.token <- "YOUR_API_KEY_HERE"
symbol <- "AAPL.US"
ticker.link <- paste("http://nonsecure.eodhd.com/api/eod/", symbol, "?api_token=", api.token, "&period=m&order=d", sep="")
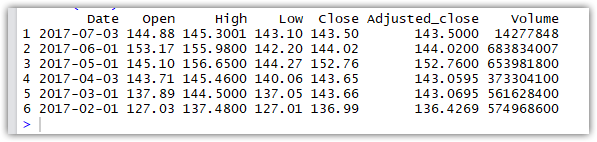
data <- read.csv(url(ticker.link))
head(data)If you run the code in RStudio (or any other software for R), you will get the following output:
Experience is similair to Yahoo Finance, only instead of:
http://ichart.finance.yahoo.com/table.csv…..we do:
http://nonsecure.eodhd.com/api/table.csvDon’t forget to add your API key an additional parameter.
We recommend to use HTTP instead of HTTPS for R language.