I found this really interesting treemap on the Finviz website. I felt inspired to try and create something similar using the EODHD APIs fundamentals data, Python, and React.js.

I did some research into what data the EODHD APIs can provide and through which API endpoints. I also investigated what libraries Python and React.js has to create such visualisations. This representation of data is called a treemap.
Quick jump:
Sourcing the data
The data we would like to use will come from the EODHD Fundamental APIs. In order to retrieve the data we need, you will need a subscription that provides “Fundamental Data“. It’s also important to note that there are daily limits on how much data can be retrieved. While writing this article I did manage to exceed the daily limit on one of the days, which I believe is 5000. The Finviz full tree map by “Sector” would require a significant amount of requests. In order to work within the limits I found that there are 4300 “Common Stocks” listed in the NASDAQ, so that’s what was used for this tutorial.
Create yourself a new Python project and install the “eodhd” Python library, then create yourself a configuration file called “config.py” that looks like this.
API_KEY="YOUR API KEY"Create yourself a Python file that will retrieve a list of the “Common Stocks” on the “NASDAQ“. The “list_symbols” variable below contains the list of symbols E.g., “AAPL.US“.
Iterate through the symbols and request the fundamentals data for each symbol. This process can take a while. Once the 4300 entries has been processed, the results are saved in a “data.csv” and “data.json” for further processing.
I had a look through the Fundamental Data (and there is a lot). The information I need is the “Sector” from “General” and the “MarketCapitalzation” from “Highlights“.
import config as cfg
from eodhd import APIClient

def main() -> None:
    api = APIClient(cfg.API_KEY)

    df_symbols = api.get_exchange_symbols("US")
    df_symbols = df_symbols[df_symbols["Exchange"] == "NASDAQ"]
    df_symbols = df_symbols[df_symbols["Type"] == "Common Stock"]
    df_symbols = df_symbols[["Code"]] + ".US"

    list_symbols = df_symbols["Code"].tolist()
    # print(list_symbols)

    results = []
    for ticker in list_symbols:
        print(f"Processing: {ticker} :")
        json_data = api.get_fundamentals_data(ticker)

        result = {}
        result["Ticker"] = ticker
        result["Sector"] = json_data["General"]["Sector"]
        result["MarketCapitalization"] = json_data["Highlights"]["MarketCapitalization"]
        print(result)

        results.append(result)
        print("Length: ", len(results))

    with open("data.json", "w") as file:
        json.dump(results, file, indent=4)

    df = pd.DataFrame(results)
    df.to_csv("data.csv", index=False)
print(df)Preprocessing the data
For the next stage, I will read the “data.csv” into a Pandas Dataframe, and preprocess it. The next part can be split into sections. The first section is to filter down the data we require, which in this case will be the “Technology” sector. I noticed there were some null values that we will want to remove with “dropna“, and then convert the column into an integer type.
   df = pd.read_csv("data.csv")
    df_technology = df[df["Sector"] == "Technology"]
    df_technology = df_technology.dropna(subset=["MarketCapitalization"])
    df_technology["MarketCapitalization"] = df_technology[
        "MarketCapitalization"
    ].astype(int)
I filtered down the dataset by the 10 largest markets by “MarketCapitalization“. The “MarketCapitalization” is listed in millions of USD. I converted this to a percentage, and rounded it to two decimal places to make it more visually appealing.
    df_technology_top10 = df_technology.nlargest(10, "MarketCapitalization")
    df_technology_top10["Percentage"] = ((
        df_technology_top10["MarketCapitalization"]
        / df_technology_top10["MarketCapitalization"].sum()
    ) * 100).round(2)
What I am working towards is a JSON string that can be easily loaded by a React.js application. Typically most libraries will expect at very least columns called “name” and “value“. In some cases “children” will be required too. In order to get to our end state I will drop “Sector” as we know its “Technology” and “MarketCapitalization” as we will use “Percentage” instead. I then renamed the columns to map “Ticker” to “name“, “Percentage” to “value“, and set “children” to None.
    df_technology_top10.drop(columns=["Sector", "MarketCapitalization"], inplace=True)
    df_technology_top10.rename(columns={"Ticker": "name", "Percentage": "value"}, inplace=True)
    df_technology_top10["children"] = None
    print(df_technology_top10)
Save the results as “technology_top10.csv“, that will be in the input to the React.js application.
    df_technology_top10.to_csv("technology_top10.csv", index=False)
    with open("technology_top10.json", "w") as file:
       df_technology_top10.to_json(file, orient="records")
Rendering the Treemap in Python
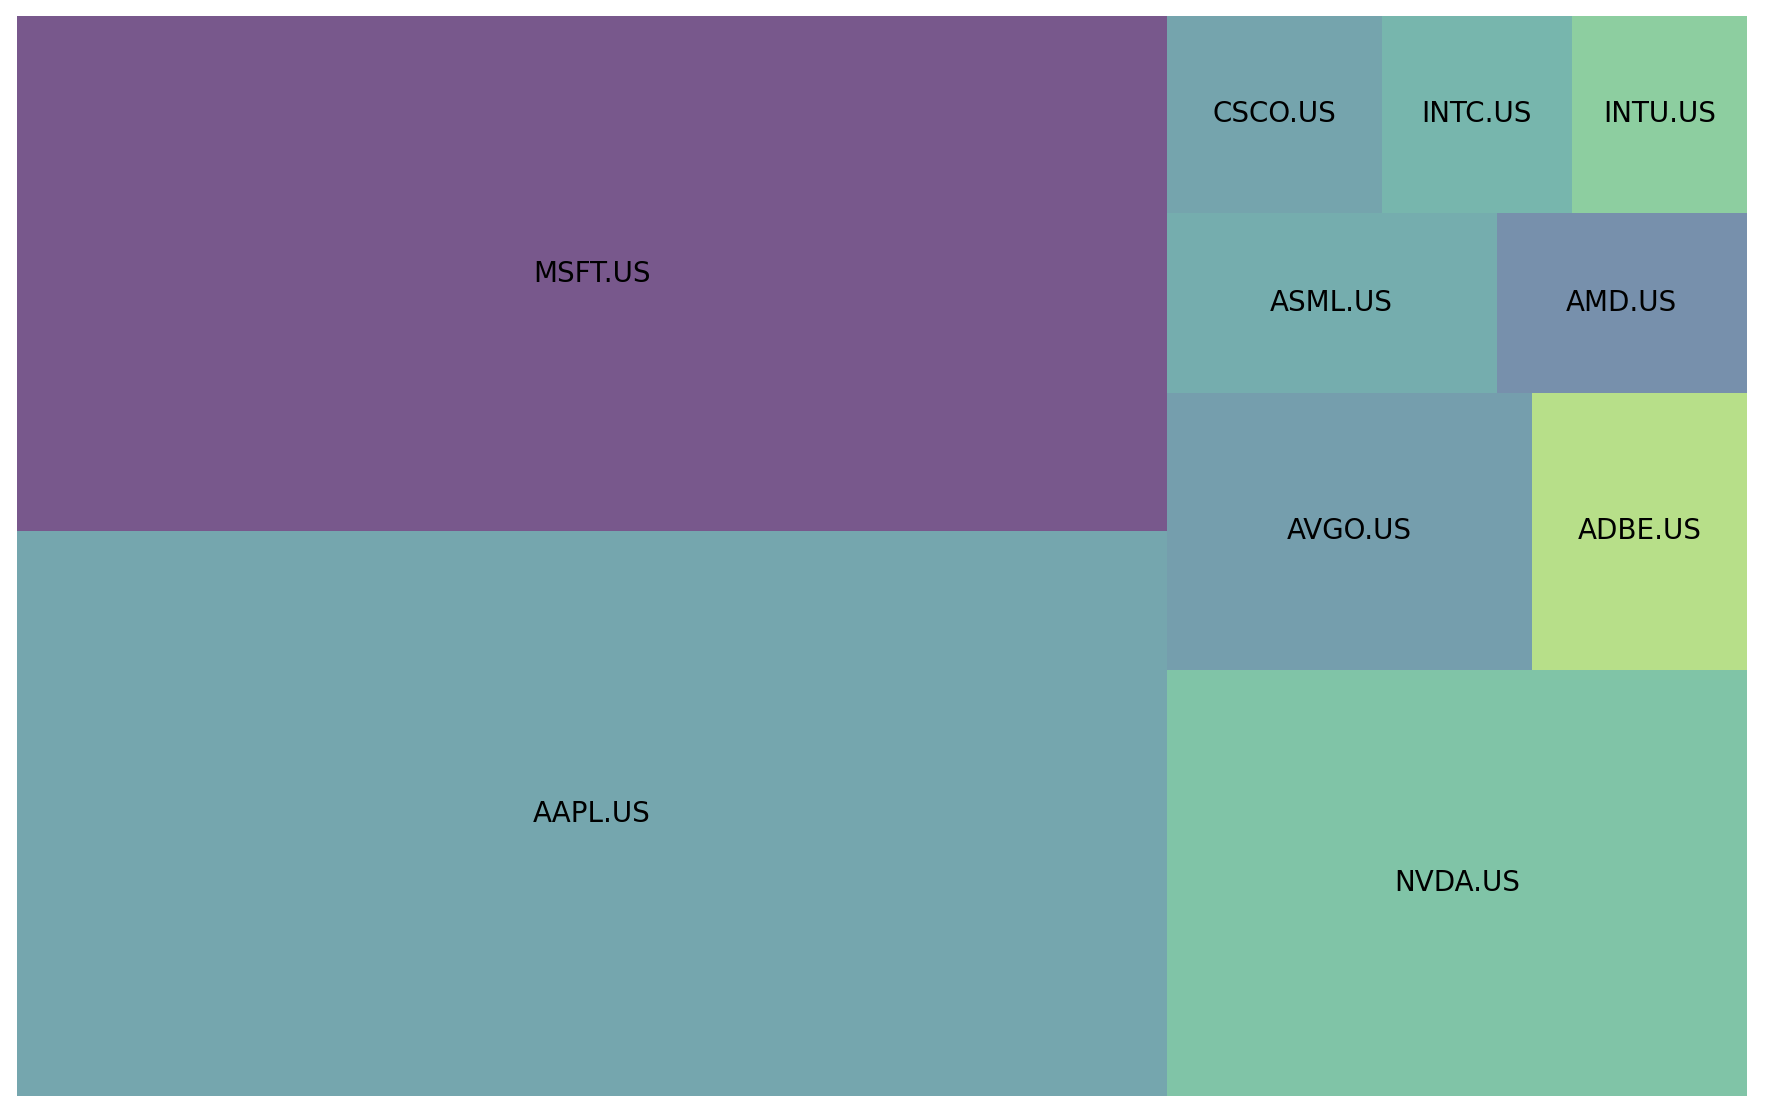
There are libraries available to render a treemap in Python. “squarify” which uses “matplotlib” looks like the most common. I tried it out but it did seem very basic.
import squarify
import matplotlib.pyplot as plt

    labels = df_technology_top10["name"].tolist()
    sizes = df_technology_top10["value"].tolist()

    squarify.plot(sizes=sizes, label=labels, alpha=0.7, pad=False)
    plt.axis("off")
    plt.show()
The good news is it worked with minimal code, the bad news is that this is about as good as it gets. You can’t add additional information easily. It can be done but requires all the blocks to be the same dimensions which defeats the purpose. It’s useful to know how to do this but I personally don’t think it’s all that exciting to look at.
Rendering the Treemap in React.js
I have my “technology_top10.json” file to use as an input for my React.js web app. It looks like this:
[{"name":"AAPL.US","value":34.76,"children":null},{"name":"MSFT.US","value":31.71,"children":null},{"name":"NVDA.US","value":13.24,"children":null},{"name":"AVGO.US","value":5.42,"children":null},{"name":"ADBE.US","value":3.19,"children":null},{"name":"ASML.US","value":3.18,"children":null},{"name":"AMD.US","value":2.41,"children":null},{"name":"CSCO.US","value":2.26,"children":null},{"name":"INTC.US","value":2.0,"children":null},{"name":"INTU.US","value":1.84,"children":null}]I will use the standard “create-react-app” tool to create myself a React.js starter application.
% npx create-react-app treemap --template typescriptWhen this has completed you should be able to run the React.js with “npm run start“.
% cd treemap
treemap % npm run start
Please note that I’m using a Typescript template with “–template typescript“. We are going to use the “react-d3-treemap” library, that you can install in the usual way, “npm install react-d3-treemap –legacy-peer-deps“.
You will want to make the following adjustments to the default code.
- Replace the App.tsx.
You will see that I included the contents of the “technology_top10.json” below. I had to replace the “children: null” with “children: []” to get this to work.
import "./App.css";
import TreeMap from "react-d3-treemap";
import React from "react";

interface TreeMapInPutData {
  name: string;
  value?: number;
  children: Array<TreeMapInPutData> | null;
  onClick?: any;
}

export default class App extends React.Component<
  unknown,
  { data: TreeMapInPutData }
> {
  private treeMapRef: React.RefObject<TreeMap<TreeMapInPutData>>;
  constructor(props: {}) {
    super(props);
    this.state = {
      data: {
        name: "Technology",
        children: [
          { name: "AAPL.US", value: 34.76, children: [] },
          { name: "MSFT.US", value: 31.71, children: [] },
          { name: "NVDA.US", value: 13.24, children: [] },
          { name: "AVGO.US", value: 5.42, children: [] },
          { name: "ADBE.US", value: 3.19, children: [] },
          { name: "ASML.US", value: 3.18, children: [] },
          { name: "AMD.US", value: 2.41, children: [] },
          { name: "CSCO.US", value: 2.26, children: [] },
          { name: "INTC.US", value: 2.0, children: [] },
          { name: "INTU.US", value: 1.84, children: [] },
        ],
      },
    };
    this.treeMapRef = React.createRef();
  }

  render() {
    return (
      <div className="div-style">
        <TreeMap<TreeMapInPutData>
          nodeStyle={{
            fontSize: 12,
            paddingLeft: 10,
            stroke: "transparent !important",
            alignSelf: "center !important",
            alignContent: "center !important",
          }}
          data={this.state.data}
        />
      </div>
    );
  }
}
2. Replace the App.css
.App {
  font-family: sans-serif;
  text-align: center;
}

.div-style {
  display: inline-grid;
  grid-template-columns: 30% 70%;
}
3. Replace the index.jsx
import { StrictMode } from "react";
import ReactDOM from "react-dom";

import App from "./App";

const rootElement = document.getElementById("root");
ReactDOM.render(
  <StrictMode>
    <App />
  </StrictMode>,
  rootElement
);
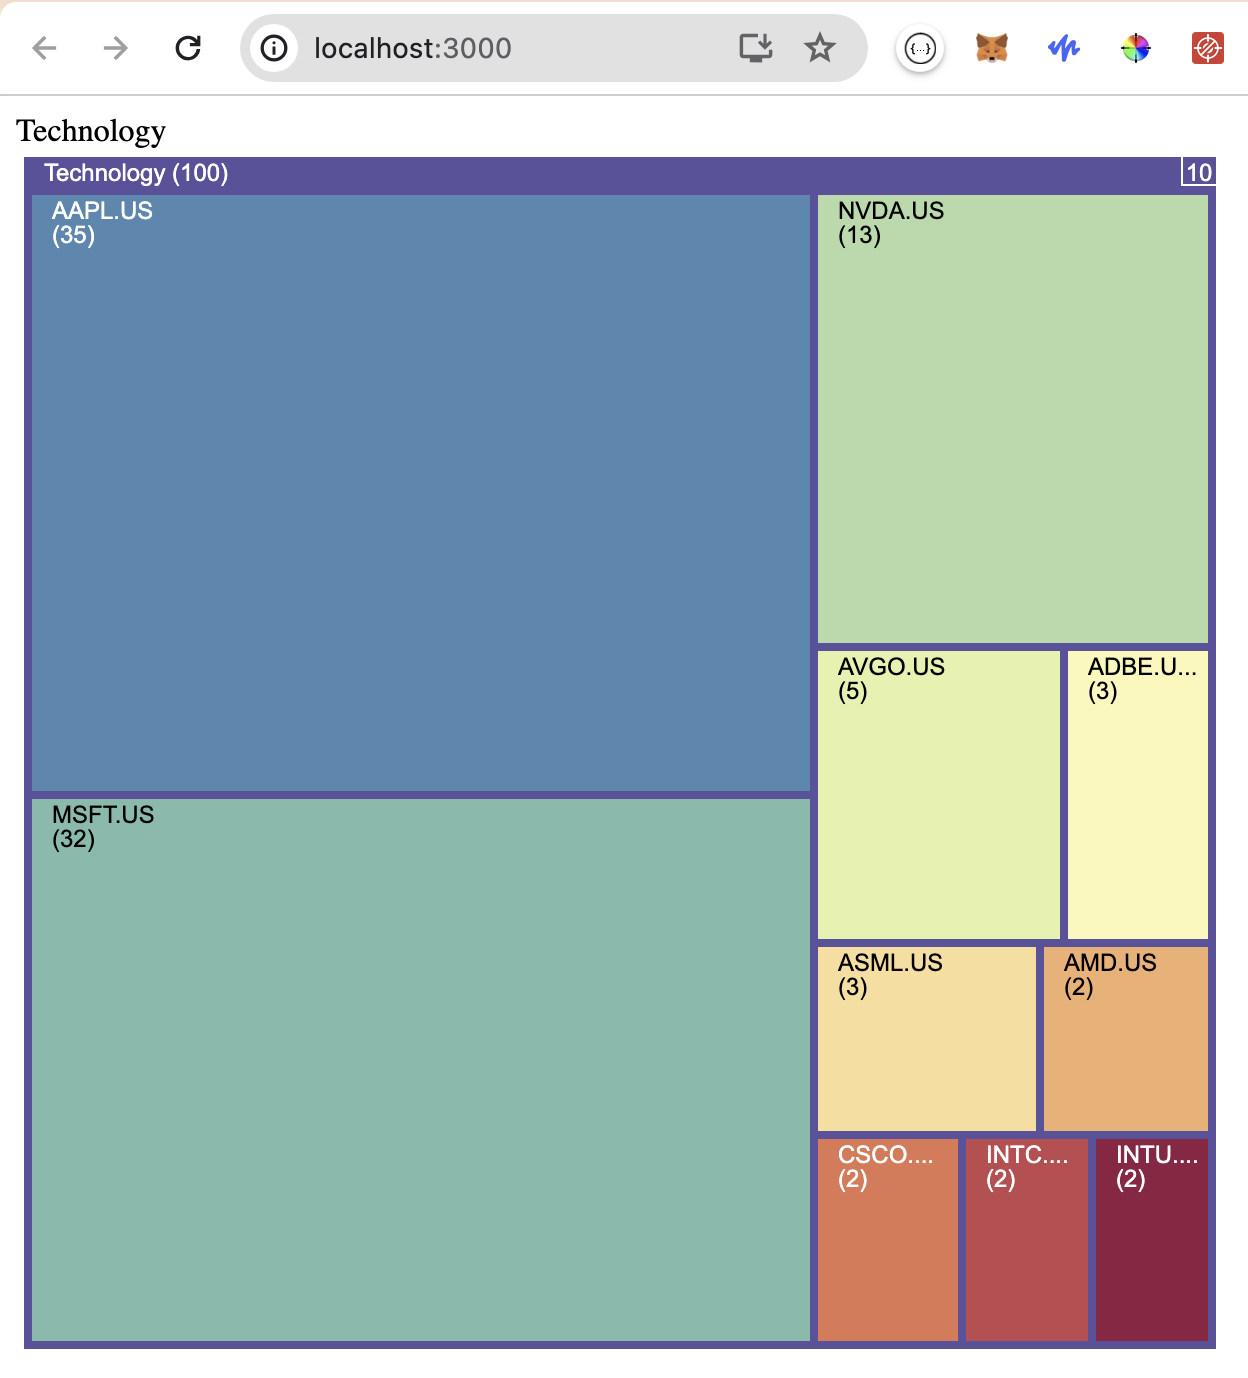
And the result looks like this…

This looks and works a lot better than the Python alternative. The boxes all have a mouse-over tooltip enabled. The numbers under the symbols is the percentage of the full area.
Summary
You may be wondering why I didn’t build this all in React.js. There are a number of reasons why I used Python for the data collection and preprocessing.
- React.js works client-side within the user’s browser. All React.js code, including the EODHD API keys, would be visible to the user. I wanted to make sure that the data requests to the API were secure and used the Python library.
- React.js connecting to a 3rd party API will almost surely be blocked if it’s setup correctly. As expected EODHD has CORS filters preventing React.js from communicating directly with it.
- Retrieving the list of symbols and the fundamental data takes over an hour. This would not be possible front-end within a user’s browser. It made sense to retrieve the data, pre-process it and then provide the finished result to the React.js web app.

