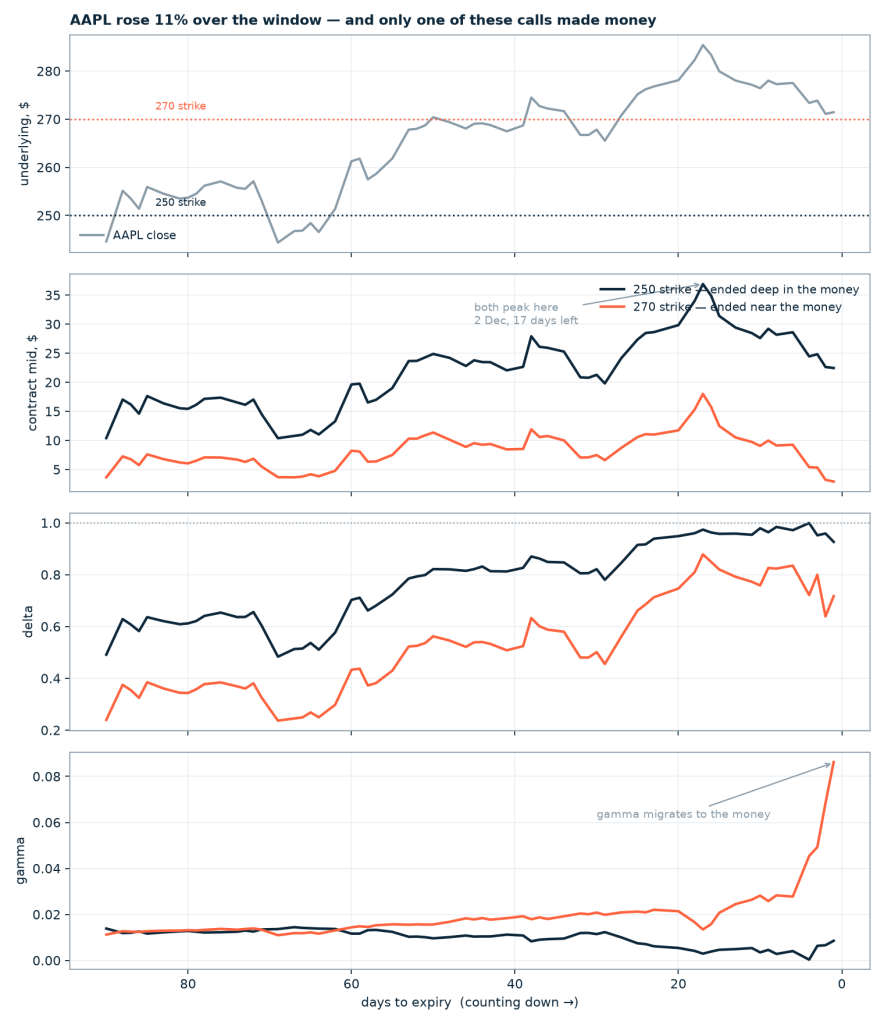

Every options tutorial has the same diagram: a smooth curve showing time decay, drawn from a formula. It’s correct and it teaches you almost nothing, because the interesting part isn’t the shape of the curve — it’s what the numbers actually do to a real contract that real people were trading.
So let’s take two of them and watch their entire lives, field by field.
Both are Apple calls expiring on 19 December 2025. One was struck at 250, the other at 270. Over the last 90 days of their lives Apple rose 11%, from 244.60 to 271.45. The 250 call more than doubled. The 270 call lost a fifth of its value. Same underlying, same expiry, the stock going the way both needed it to — opposite outcomes, and the reason is visible in the data day by day. Every option price below is the midpoint of the closing bid and ask — a mark, not an execution, and I’ll come back to what that costs.
Where the data comes from. Everything here is built on the EODHD US Stock Options Data API, which serves one daily record per listed US equity option contract: volume, open interest and their daily changes, bid and ask with sizes, implied volatility and its change, all five Greeks, days to expiry and moneyness. A contract’s entire history comes back in a single request. The API documentation has the full field list.
You can run every line below without an account: EODHD publishes a demo token that answers for AAPL and AMZN, and that’s the token in the code.
Two contracts, two requests
Option contract symbols are mechanical once you’ve seen one: the underlying, the expiry as YYMMDD, C or P, then the strike times a thousand padded to eight digits. So the 250 call expiring 19 December 2025 is AAPL251219C00250000.
import requests

# EODHD US Stock Options Data API
# docs: https://eodhd.com/marketplace/unicornbay/options/docs
BASE = "https://eodhd.com/api/mp/unicornbay/options"
TOKEN = "demo"          # EODHD's public demo token: AAPL and AMZN, no signup

FIELDS = ("contract,tradetime,exp_date,dte,strike,type,volume,open_interest,"
          "open_interest_change,bid,ask,volatility,volatility_change,"
          "delta,gamma,theta,vega,rho,moneyness")

def contract_life(symbol):
    """Every session this contract ever traded, oldest first."""
    r = requests.get(f"{BASE}/eod", params={
        "filter[contract]": symbol,
        "fields[options-eod]": FIELDS,
        "page[limit]": 1000, "api_token": TOKEN,
    })
    rows =  for row in r.json().get("data", [])]
    rows = [x for x in rows if x.get("tradetime")]
    return sorted(rows, key=lambda x: x["tradetime"])

itm = contract_life("AAPL251219C00250000")   # ended deep in the money
atm = contract_life("AAPL251219C00270000")   # ended near the money

print(len(itm), "sessions:", itm[0]["tradetime"], "→", itm[-1]["tradetime"])
565 sessions: 2023-10-02 → 2025-12-18565 sessions in one request, going back to when the contract was first listed — more than two years before it expired. That’s the whole life of the thing, and it costs one call.
A row carries 43 fields. I’m asking for 19 of them, which is enough for everything below; the rest are mostly the other ways to look at the same session — open, high, low, last and its size, the sizes and timestamps behind the bid and ask, the vendor’s own midpoint and theoretical value, day-over-day changes in volume and open interest as percentages, and the flag saying whether the contract is a weekly, a monthly or a quarterly.
I’ll work with the last 90 days of each, which is 65 trading sessions and where everything interesting happens. That window has a second advantage I’ll come back to at the end: three of the fields above are only populated from October 2024 onward, and staying inside recent history keeps every column full.
Ninety days out: two different instruments
On 19 September, with Apple at 244.60, the two contracts looked like this.
| 90 days to expiry | 250 call | 270 call |
|---|---|---|
| Mid price | $10.40 | $3.65 |
| Delta | 0.491 | 0.239 |
| Gamma | 0.0139 | 0.0112 |
| Theta, $/day | −0.074 | −0.053 |
| Implied volatility | 23.6% | 22.7% |
| Open interest | 36,102 | 16,789 |
Delta is the hedge ratio: how much the contract moves per dollar of Apple, per share. At 0.491 the 250 call behaves like 49 shares once you scale by the 100 shares a contract controls; the 270 call like 24.
Both are already heavily levered, and it is worth doing the arithmetic rather than eyeballing delta. The 250 call carries 0.491 × $244.60 = $120 of share exposure for $10.40 of premium, about twelve times. The 270 call carries $59 of exposure for $3.65, about sixteen times. What separates them at this point is not leverage but how much of their value is riding on whether Apple gets through the strike at all.
Note that gamma is higher on the 250 at this point. That will invert completely, and watching it invert is the single most instructive thing in this dataset.
The whole life in four panels
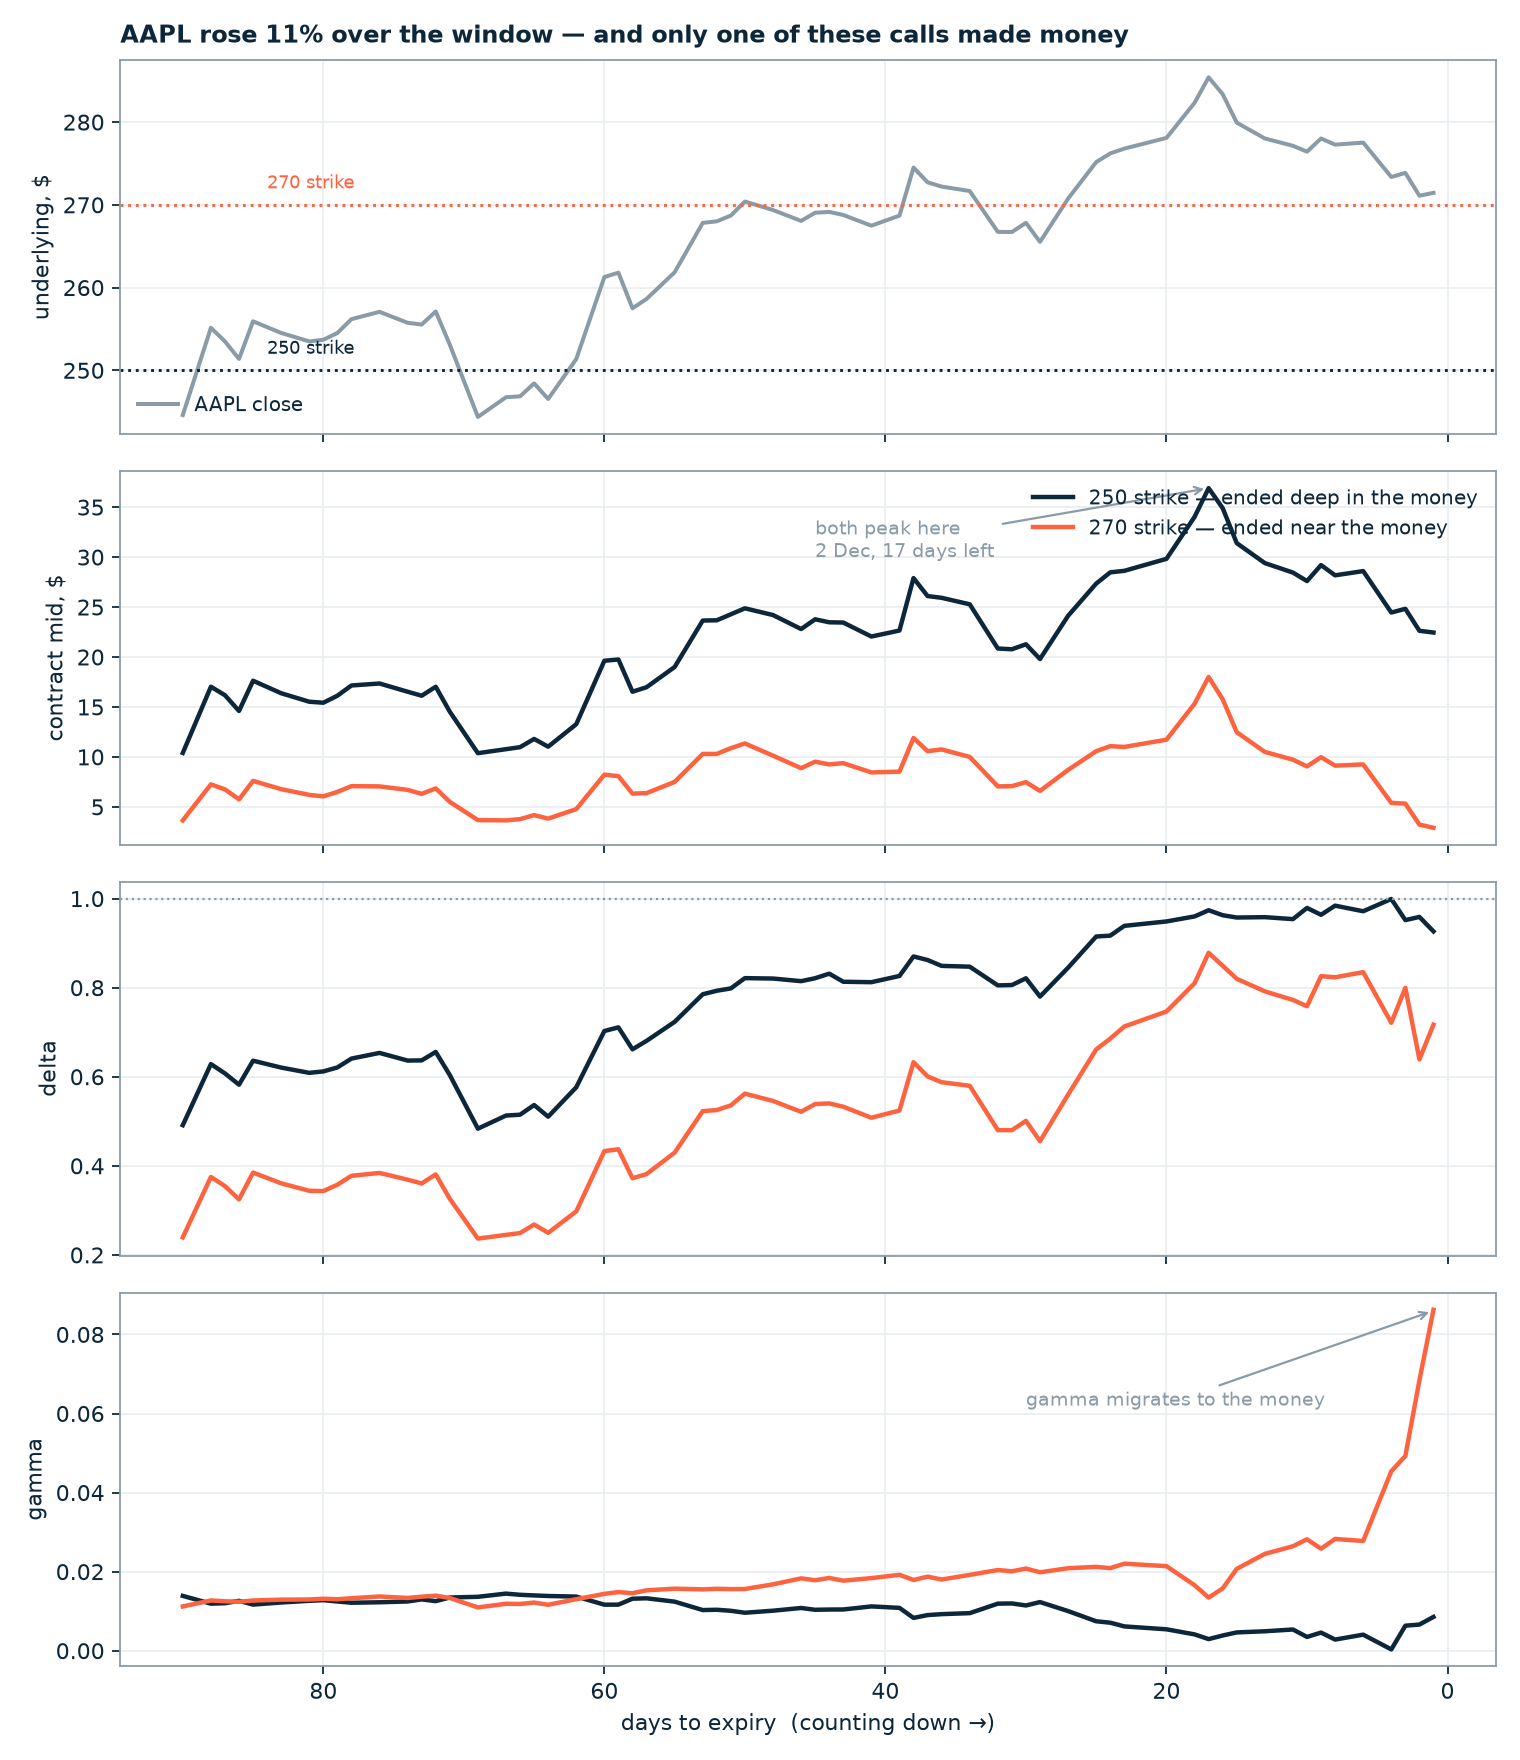
Three things to see here.
Delta ratchets toward one. The 250 call goes 0.49 → 0.70 → 0.82 → 0.96 as Apple climbs through it, and across the nine sessions before its last it never leaves the band between 0.952 and 0.999. Its sensitivity to volatility shrinks with it: median vega over the final week is 0.020, so a whole point of implied volatility moves the contract by two cents. The 270 call’s is 0.075 over the same sessions — nearly four times as vol-sensitive, on a contract worth a quarter as much.
At that point it behaves much like a hundred shares of Apple carried on credit — but not exactly, and the difference is American. These are American-style calls on a stock that pays dividends, so a holder deep in the money has to weigh exercising early to capture one. Apple went ex-dividend on 10 November, inside this window, at $0.26. I looked for the footprint and there isn’t one: the 250 call’s open interest drifts down through that week without a step (−277, −561, then +14 on the ex-date itself, then −144), because $0.26 was not worth surrendering the dollar-plus of time value still in the contract. Worth checking, not worth assuming — on a bigger dividend or a thinner time premium the answer flips.
Both contracts reach their highest closing mid on the same day. 2 December, seventeen days from expiry, with Apple at its window high of 285.41. The 250 call marked $36.90, the 270 call $18.00 — the latter a five-fold gain on the $3.65 it cost at the start of the window, sitting on the screen at a price nobody had to accept.
Then the last seventeen days happen. Apple slid from its high back to 271.45, and the 270 call went from $18.00 to $2.91 — it gave back 84% of its peak value while the underlying fell about 5%. The 250 call went from $36.90 to $22.45 over the same stretch, a 39% drawdown. Same move in the stock, wildly different damage.
Gamma moves house
Here are the two contracts side by side at six points in their lives. This is the table I’d put in front of anyone who thinks a cheaper strike is a cheaper way to be long.
| Days left | AAPL | 250: delta | 250: gamma | 250: theta | 270: delta | 270: gamma | 270: theta |
|---|---|---|---|---|---|---|---|
| 90 | 244.60 | 0.491 | 0.0139 | −0.074 | 0.239 | 0.0112 | −0.053 |
| 60 | 261.27 | 0.703 | 0.0116 | −0.102 | 0.433 | 0.0144 | −0.100 |
| 30 | 267.83 | 0.821 | 0.0114 | −0.119 | 0.501 | 0.0208 | −0.140 |
| 14 | 279.94 | 0.958 | 0.0046 | −0.081 | 0.820 | 0.0207 | −0.132 |
| 7 | 277.28 | 0.984 | 0.0028 | −0.058 | 0.823 | 0.0283 | −0.170 |
| 1 | 271.45 | 0.927 * | 0.0085 * | −1.000 * | 0.717 | 0.0862 | −0.681 |
Gamma starts at 0.0139 against 0.0112 — the 250 has more. By seven days out it is 0.0028 against 0.0283, exactly ten times the other way, and the 250 call bottoms at 0.0003 four days from expiry. Gamma is not a conserved quantity that literally moves between strikes; each contract’s curvature simply responds to its own moneyness and remaining time. But the visible effect inside one expiry is that the highest gamma concentrates on whichever strikes are still near the money, and the closer expiry gets, the narrower and taller that concentration becomes.
That’s the whole story of why the 270 call was the more dangerous instrument even though it was the cheaper one. High gamma near expiry means the position’s own directional exposure swings violently with small moves in the stock — its delta went from 0.82 to 0.72 in the final days without anyone doing anything. You are not holding a small long position; you are holding something whose size changes under you.
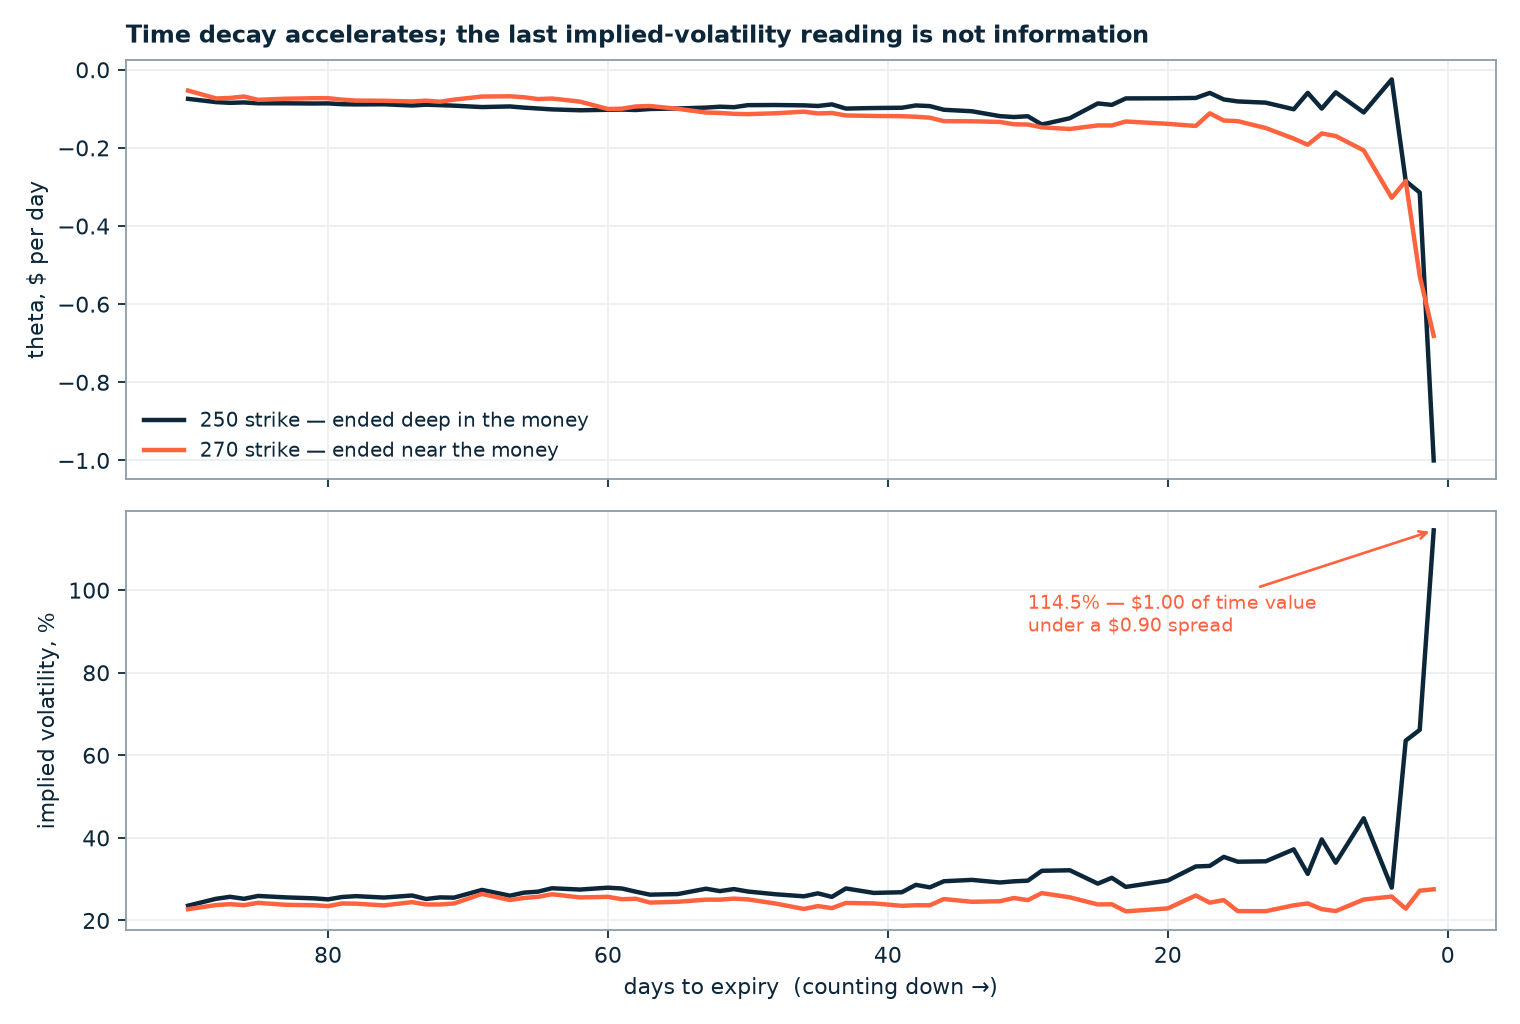
Theta tells the matching half, with one caveat: theta is the model’s estimate of decay holding the stock and volatility fixed, not rent the contract mechanically pays. Realised daily profit and loss mixes it with everything else that moved. As a model quantity the 270 call’s decay accelerates from −0.053 to −0.170 a day, and measured against each contract’s own price the gap is brutal — over the four sessions inside the final week the 270 call’s theta ran at an average of 7.5% of its own value per day, 16% on the worst of them, against 0.8% a day for the 250.
The punchline: right direction, lost money
Put the two ends of the window together.
| Marked at the closing mid | Start of window | Last trading session | Change |
|---|---|---|---|
| AAPL | 244.60 | 271.45 | +11.0% |
| 250 call | $10.40 | $22.45 | +116% |
| 270 call | $3.65 | $2.91 | −20% |
Apple went up 11% and the 270 call lost money. The stock went the way the trade needed — but direction alone was never the bet. What the 270 call needed was for Apple to be far enough above 270 at expiry to cover the $3.65 it cost, and to get there without giving the move back first. It arrived, then partly left, and the calendar charged for the wait. At the end the contract’s $2.91 mark was $1.45 of intrinsic value and $1.46 of time value with one day left to run.
And now the promise from the top, about what marking to mid costs. Do it the unforgiving way — pay the ask going in, take the bid coming out — and the 270 call bought at $3.70 and sold at $2.85 returns −23% instead of −20%. The 250 call, bought at $10.45 and sold at $22.00, makes +111% instead of +116%. So the mid flatters the result by three to five percentage points on contracts this liquid. Worth knowing, and not enough to change either story — which is exactly why it was worth checking rather than assuming.
This is the thing the smooth textbook curve cannot show you, because the textbook curve holds the stock still.
One row in this data is not data
On its last trading session the 250 call’s implied volatility reads 114.5%, up from 34% a week earlier. Apple did not become four times as volatile overnight. Here’s the row:
| Underlying close | 271.45 |
| Strike | 250 |
| Bid / ask | $22.00 / $22.90 |
| Mid | $22.45 |
| Intrinsic value | $21.45 |
| Time value | $1.00 |
| Spread width | $0.90 |
With one day to expiry, everything the option is worth except one dollar is just the difference between the stock and the strike. Implied volatility is solved backwards from that one dollar — and the bid-ask spread around it is ninety cents. The uncertainty in the input is nearly the whole input, and vega on that row is 0.02, meaning a full point of volatility is worth two cents. Inverting a price into a volatility under those conditions is numerically ill-conditioned: tiny errors in the input map to enormous swings in the output.
So 114.5% is not a market view. And here is the part I nearly missed, which matters more than the number itself: the Greeks on that row come out of the same broken fit. If the volatility is garbage, everything solved alongside it is garbage too.
You can check it in a few lines. A call 21.45 points in the money with one day left should have a delta of essentially one. Price it yourself:
| Delta of the 250 call at 1 DTE, spot 271.45 | Value |
|---|---|
| As reported by the vendor | 0.927 |
| Black-Scholes at the vendor’s own 114.5% volatility | 0.920 |
| Black-Scholes at 20%, 25%, 30% or 40% volatility | 1.0000 |
The vendor’s delta is internally consistent — with its own broken volatility. Feed the model any sane number and delta pins to one. Two more tells on the same row: theta is reported as −0.999999, which looks like a floor in the model rather than a calculation, and gamma rises from 0.0028 seven days out to 0.0085 on the last day, which is backwards for a contract that deep in the money. Three columns, one bad inversion.
The rule this suggests is general and worth keeping: on a deep in-the-money contract near expiry, neither the implied volatility nor the fitted Greeks carry much information, because there is almost no extrinsic value left for either to be inferred from. If you’re building an implied-volatility series, this is exactly the row that will poison it — and it’s why any serious study filters on moneyness and time to expiry before touching the IV column, and treats the Greeks from those same rows with equal suspicion.
The 270 call, which still had real time value, reads 27.6% on the same session. That one you can believe.
Who was actually trading these
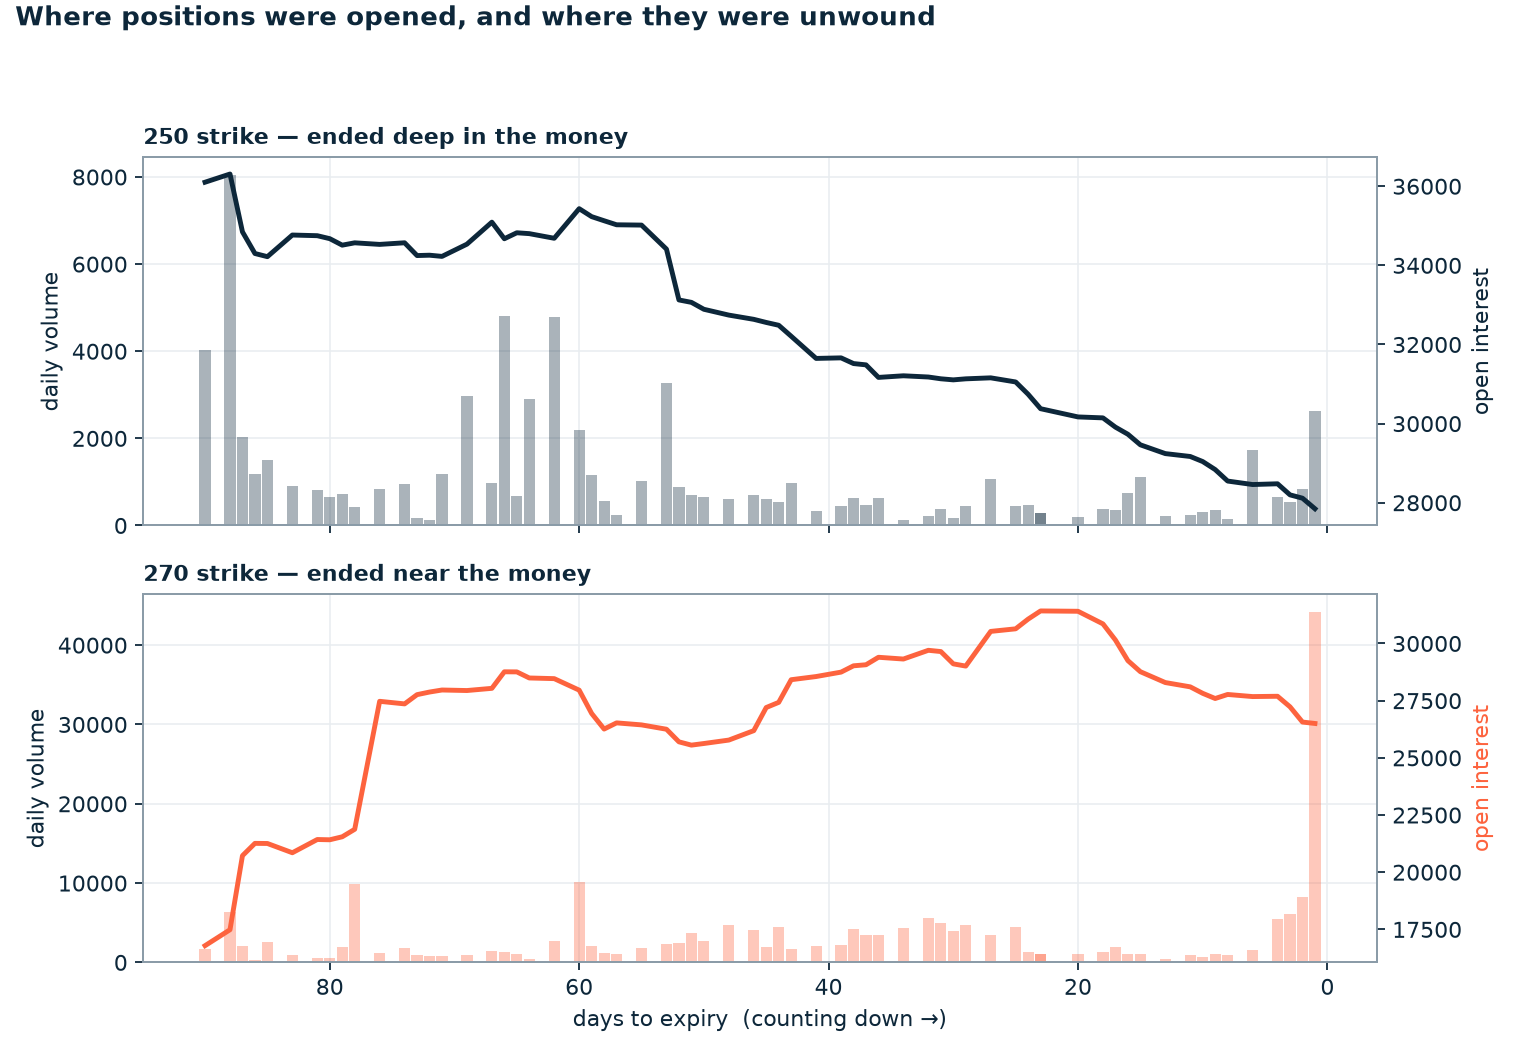
Volume tells you contracts changed hands. The daily change in open interest tells you whether positions were being created or retired — and those are different stories.
| Over the 65-session window | 250 call | 270 call |
|---|---|---|
| Total volume | 71,782 | 211,180 |
| Peak open interest | 36,309 | 31,423 |
| Open interest at the end | 27,848 | 26,503 |
| Sessions that opened positions | 5 | 13 |
| Sessions that closed positions | 26 | 12 |
| Sessions of churn | 34 | 40 |
I classified each session with a simple rule: if the change in open interest exceeds a fifth of the day’s volume it counts as net opening, below minus a fifth as net closing, and everything between as mixed — too much trading for too little net change. Note what this does not tell you. Open interest change is a net figure after clearing: it cannot identify who traded or why, and a single contract’s history cannot identify a roll, which by definition involves a second contract.
A fifth is an arbitrary cut, so here is what happens when you move it:
| Threshold | 250 call: opening / closing | 270 call: opening / closing |
|---|---|---|
| ±10% of volume | 7 / 37 | 17 / 14 |
| ±20% of volume | 5 / 26 | 13 / 12 |
| ±30% of volume | 4 / 17 | 12 / 10 |
The counts move, the asymmetry doesn’t: the 250 call runs four to five closing sessions for every opening one at every threshold, and the 270 call stays balanced. That is the finding, and it doesn’t depend on where I drew the line.
The 250 call — already in the money when the window opened — had 26 net-closing sessions against 5 net-opening ones, and its open interest fell from 36,309 to 27,848 without ever meaningfully rising: net −8,555 across the window. Positions were retired far more than created, though the data cannot say by whom, or how much of the decline was exercise rather than trading. The 270 call did the opposite: open interest climbed from 16,789 to a peak of 31,423 with three weeks to go, including single days that added 5,595 and 3,237 contracts, for a net of +10,231 before it unwound.
And it drew three times the volume — 211,180 contracts against 71,782 — with 44,214 on its last trading session alone, the biggest day of its life, the day before it expired nearly worthless. On one contract you cannot say what that flow was: closing trades, gamma scalping, conversions, or somebody’s lottery ticket. It is at least consistent with the heavy turnover that near-the-money short-dated contracts tend to see going into expiry.
The quote gets worse exactly when you need it
One more column worth watching, because it costs real money and nobody puts it in a tutorial.
| Relative bid-ask spread | 250 call | 270 call |
|---|---|---|
| Median with 60+ days left | 1.3% | 2.0% |
| Median over the whole window | 1.6% | 2.2% |
| Median in the final week | 4.0% | 3.7% |
| Average over the last five sessions | 4.3% | 4.1% |
| Widest single session | 9.0% (50 days out) | 7.8% (2 days out) |
Measured against the same contract earlier in its life, the relative spread roughly triples: 1.3% to 4.0% on the 250 call, 2.0% to 3.7% on the 270. Note that the single widest quote on the 250 call was not at the end at all — it was 9.0% fifty days out, on a day it barely traded — which is a useful reminder that a maximum is one observation and a median is a pattern.
Several things widen a quote near expiry, and the payoff turning into a step function is only the first. A market maker’s hedge error grows with gamma, so the same position costs more to carry. Assignment and overnight gap risk arrive with no time left to manage them. And as extrinsic value shrinks toward a few cents, the minimum tick becomes a large fraction of the price all by itself — a two-cent market on a forty-cent option is 5% wide before anyone has made a decision. The net effect is that the moment a near-the-money position is swinging most violently is also the moment getting out costs the most.
If you take one practical thing from this article, take that one.
What the history does not give you
An honest note about the data, because I hit this while writing and you would hit it too.
Contract history goes back to October 2023, and the Greeks, implied volatility and bid/ask are populated all the way. But three fields — days to expiry, moneyness, and the daily change in open interest — are only filled in from 3 October 2024 onward. I checked four contracts with different expiries and the boundary is the same date in every one:
| Contract | Sessions | With change in OI | First one |
|---|---|---|---|
| AAPL240119C00190000 | 76 | 0 | — |
| AAPL250117C00250000 | 326 | 73 | 2024-10-03 |
| AAPL251219C00270000 | 565 | 312 | 2024-10-03 |
| AAPL260116C00250000 | 585 | 332 | 2024-10-03 |
None of this is fatal, because all three are derivable. Days to expiry is the difference between the expiry date and the session date. Moneyness needs the underlying’s close, which is one more request. And the change in open interest is just the difference between consecutive rows of the open interest column, which you have:
from datetime import date

def backfill(rows):
    """Derive dte and the change in open interest for older sessions."""
    prev_oi = None
    for r in rows:
        if r.get("dte") is None:
            d1 = date.fromisoformat(r["exp_date"][:10])
            d0 = date.fromisoformat(r["tradetime"][:10])
            r["dte"] = (d1 - d0).days
        if r.get("open_interest_change") is None and prev_oi is not None:
            r["open_interest_change"] = (r["open_interest"] or 0) - prev_oi
        prev_oi = r["open_interest"] or 0
    return rows
Worth knowing that the derived change in open interest and the served one are not quite the same thing: mine is the difference between two published snapshots, so a missing session leaves a two-day gap labelled as one day. For the recent window in this article I used the served field and didn’t need any of this.
Run it yourself
Two requests, one per contract, and the demo token covers both. Nothing here needs an account, and nothing here takes more than a few seconds.
Things worth trying. Run the same pair on a put and watch delta walk toward minus one instead. Pick a contract that expired out of the money and see what the last week looks like when gamma piles into something that’s about to be worth nothing. Or take a strike far out of the money and check how much of its life has a bid at all — that’s the version of this exercise that teaches you which contracts are real and which are just listed.
Beyond AAPL and AMZN you’ll need your own key for the EODHD US Stock Options Data API. What made this article possible is that one row carries the price, the quote, the volume, the open interest and all five Greeks together — you don’t compute the Greeks, and you don’t join three sources to get a contract’s life. That’s the difference between a chart like the one above and an afternoon of plumbing. The flip side, as the 250 call’s last row shows, is that you inherit somebody else’s model: the implied volatility and Greeks embed the vendor’s treatment of rates, discrete dividends and American-style early exercise, and it costs nothing to sanity-check a row against your own pricer when the answer looks strange.
And if you only remember one row from all of this, make it the last one on the 250 call: a triple-digit implied volatility, produced by a model, printed in a database, and meaning nothing at all. Look at what a number is made of before you build on it.