

In the world of stock trading, strategies are key. One such strategy, Breakout Trading (BT), stands out for its effectiveness. BT is a method where traders enter the market when the price makes a move above a certain level. This strategy is based on the idea that once a price breaks through a resistance level, it will continue to move in the same direction.
Python, a versatile and powerful programming language, is an excellent tool for implementing BT. With Python, traders can automate the process of identifying breakout points, making it easier to spot potential investment opportunities. This article will delve into the intricacies of BT and demonstrate how Python, coupled with the EODHD API, can be used to execute this strategy effectively.
Quick jump:
Understanding Breakout Trading
Breakout Trading (BT) is a strategy used by traders to identify potential investment opportunities. A breakout occurs when the price of an asset moves above a resistance area or below a support area. These movements indicate the potential for the price to start trending in the breakout direction.
In BT, support and resistance levels play a crucial role. These levels act as a line in the sand, setting entry points or stop loss levels for traders. When the price breaks through these levels, traders waiting for the breakout jump in, while those who didn’t want the price to breakout exit their positions to avoid larger losses.
There are two types of breakouts: Bullish and Bearish. A Bullish breakout occurs when the price breaks above the resistance level, indicating a potential upward trend. On the other hand, a Bearish breakout happens when the price breaks below the support level, signaling a possible downward trend.
However, it’s important to note that not all breakouts result in a new trend. Sometimes, the price moves just beyond the resistance or support, luring in traders, and then reverses direction. This is known as a failed breakout. To avoid falling into this trap, traders often look for an increase in volume on the breakout, which shows that the level is significant to a lot of traders.
Breakout Trading in Different Market Scenarios
Breakout Trading (BT) can be applied effectively in various market scenarios. Let’s explore how BT works in a bull market, bear market, and sideways market.
BT in a Bull Market
In a bull market, prices are generally rising. Traders using BT in this scenario look for breakouts above resistance levels. These breakouts indicate the potential for the price to start trending higher. High volume breakouts show greater conviction, meaning the price is more likely to trend in the breakout direction.
BT in a Bear Market
In a bear market, prices are generally falling. Here, traders look for breakouts below support levels. These breakouts signal the potential for the price to start trending lower. As with bull markets, high volume breakouts are a good sign, indicating the price is more likely to continue moving in the breakout direction.
BT in a Sideways Market
In a sideways market, prices are not trending in a specific direction. Instead, they fluctuate within a certain range. Traders using BT in this scenario watch for breakouts above resistance or below support levels within the range. These breakouts could signal the start of a new trend.
In the further article, we will see how we can identify those breakout points and implement breakout strategy using python. But, First let’s understand and define our stock data. I will be using EODHD API to fetch the latest data of NVDA stock and will be continue my analysis on the same throughout the article.
Why EODHD is a Good Fit for Breakout Trading
EOD Historical Data (EODHD) is a comprehensive and versatile financial data provider that offers access to a wide range of financial information, including end-of-day stock data, fundamentals, options chains, and more. It provides data for over 60 stock exchanges, mutual funds, and ETFs worldwide, making it a valuable resource for traders and investors. Here are the points why EODHD api is a good fit for Breakout Trading.
- Quality Data: EODHD provides high-quality, accurate, and reliable data, which is essential for identifying support and resistance levels in Breakout Trading (BT).
- Extensive Coverage: With access to data from numerous stock exchanges, EODHD offers a broad range of information, allowing traders to apply BT across different markets.
- Ease of Use: EODHD offers a well-documented API that can be easily integrated with Python, making it accessible for both novice and experienced programmers.
- Real-Time Access: For those looking to implement BT in intraday trading, EODHD provides real-time data access, allowing for timely identification of potential breakouts.
- Cost-Effective: EODHD offers various subscription plans to suit different needs, making it a cost-effective solution for individual traders and institutions alike.
Implementing Breakout Trading Strategy using Python
Python, a versatile and powerful programming language, has gained significant traction in the financial industry over the last few years. Its powerful functionality for data manipulation and analysis makes it an excellent tool for developing and backtesting a quantitative trading strategy. This section will demonstrate how Python, coupled with the EODHD API, can be used to implement the Breakout Trading (BT) strategy.
Accessing Live Stock Data Through EODHD API
The first step in implementing BT is to access live stock data. Python, coupled with the EODHD API, makes this task straightforward. The EODHD API provides access to a wealth of information, including end-of-day stock data, fundamentals, options chains, and more. This data is crucial for identifying potential breakouts and making informed trading decisions.
To fetch the NVDA stock data using the EODHD API, you can use the following Python code snippet:
from eodhd import APIClient
import pandas as pd
import matplotlib.pyplot as plt
import mplfinance as mpf
import plotly.graph_objects as go
def fetch_stock_data(symbol):
api = APIClient("YOUR_API_KEY")
data = api.get_historical_data(symbol=symbol, interval="d", iso8601_start="2022-08-08", iso8601_end="2023-08-07")
return data
# Fetch data for Apple Inc.
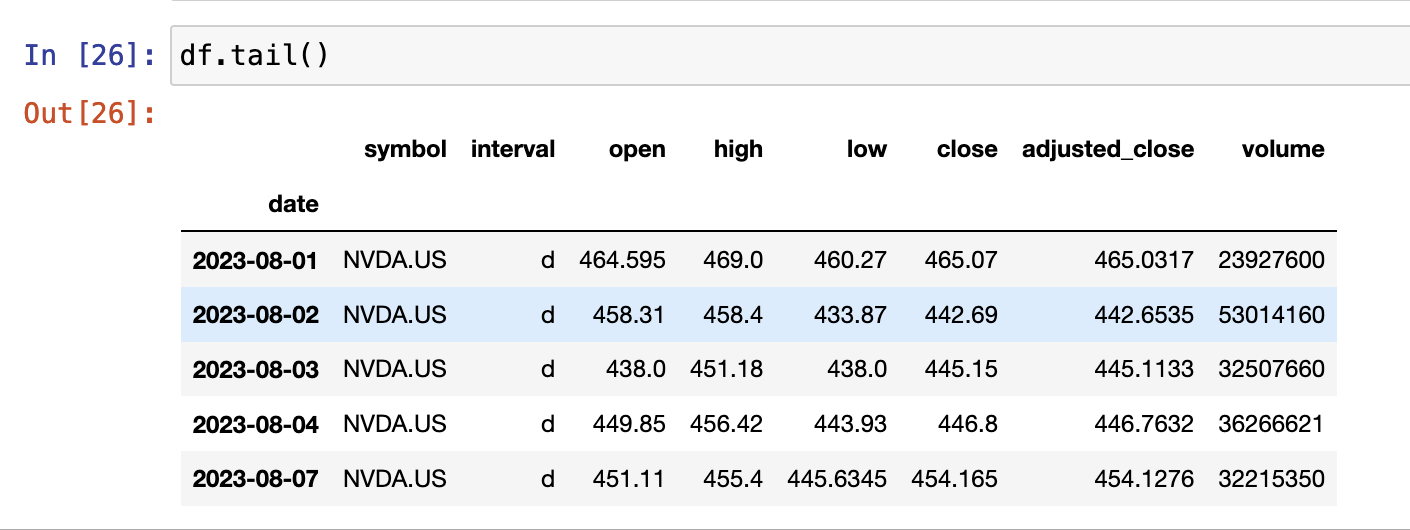
df = fetch_stock_data("NVDA.US")I will be using mplfinance and plotly to make interactive candlestick charts. These are the open source python libraries. Here is how our data looks like.
Identifying Potential Breakouts
Identifying potential breakouts is a critical aspect of Breakout Trading (BT). Breakouts occur when the price of a security moves above a resistance level or below a support level. These levels are often areas where the price has reversed direction in the past. Identifying potential breakouts can provide traders with valuable insights into the future direction of a security’s price.
Understanding Support and Resistance Levels
Support and resistance levels are key concepts in technical analysis. A support level is a price level at which a security tends to stop falling and bounce back upwards. Conversely, a resistance level is a price level at which a security tends to stop rising and reverse downwards.
These levels are often formed by the market’s psychological reaction to certain price points. For example, if a stock has repeatedly failed to move above $100, traders may see this level as a strong resistance and sell as the price approaches it.
Using Historical Price Data to Identify Levels
Historical price data can be used to identify support and resistance levels. By analyzing the past price movements of a security, traders can identify price levels where the security has repeatedly reversed direction. These levels can then be used to predict potential breakouts.
Here’s an example of how you might identify support and resistance levels using Python:
import pandas as pd
# We'll calculate the support and resistance levels using a rolling window
window_length = 20
df['Support'] = df['low'].rolling(window=window_length).min()
df['Resistance'] = df['high'].rolling(window=window_length).max()
In this code snippet, we calculate the support level as the minimum low price over a rolling 20-day window and the resistance level as the maximum high price over the same window.
Detecting Breakouts
With the support and resistance levels identified, we can use Python to monitor the live stock data and detect breakouts. A breakout is detected when the price moves above a resistance level (indicating a potential upward trend) or below a support level (indicating a potential downward trend). These breakouts can signal potential investment opportunities. A bullish breakout occurs when the price moves above a resistance level, while a bearish breakout occurs when the price moves below a support level.
# Identify bullish breakouts (closing price greater than resistance)
df['Bullish Breakout'] = df['close'] > df['Resistance'].shift()
# Identify bearish breakouts (closing price less than support)
df['Bearish Breakout'] = df['close'] < df['Support'].shift()
In this code snippet, we identify bullish breakouts as instances where the closing price is greater than the resistance level and bearish breakouts as instances where the closing price is less than the support level.
Visualizing breakouts using a candlestick chart can provide a clear and intuitive representation of the price movements, support and resistance levels, and the points where breakouts occur. Here’s a Python code snippet that demonstrates how to create a candlestick chart to visualize breakouts:
import numpy as np

# Create new columns for the bullish and bearish breakout points, filled with NaN values
df['Bullish Breakout Points'] = np.nan
df['Bearish Breakout Points'] = np.nan

# Fill the new columns with the closing prices where there are bullish and bearish breakouts
df.loc[df['Bullish Breakout'], 'Bullish Breakout Points'] = df['close']
df.loc[df['Bearish Breakout'], 'Bearish Breakout Points'] = df['close']

# Create addplots for the support, resistance, bullish breakouts, and bearish breakouts
ap1 = mpf.make_addplot(df['Support'], color='green')
ap2 = mpf.make_addplot(df['Resistance'], color='red')
ap3 = mpf.make_addplot(df['Bullish Breakout Points'], scatter=True, markersize=100, color='blue')
ap4 = mpf.make_addplot(df['Bearish Breakout Points'], scatter=True, markersize=100, color='orange')

# Create a candlestick chart with the addplots
mpf.plot(df, type='candle', style='charles', title='Breakout Visualization', ylabel='Price ($)', addplot=[ap1, ap2, ap3, ap4], figsize=(10, 6))
The provided code snippet visualizes breakout trading data using a candlestick chart. It first creates new columns in the DataFrame to store bullish and bearish breakout points, filling them based on closing prices. Then, it uses the mplfinance library to create additional plots for support and resistance levels, as well as scatter plots for the breakout points. Finally, it combines these elements into a single candlestick chart, displaying the price movements, support and resistance levels, and breakout points, all in one comprehensive visualization.
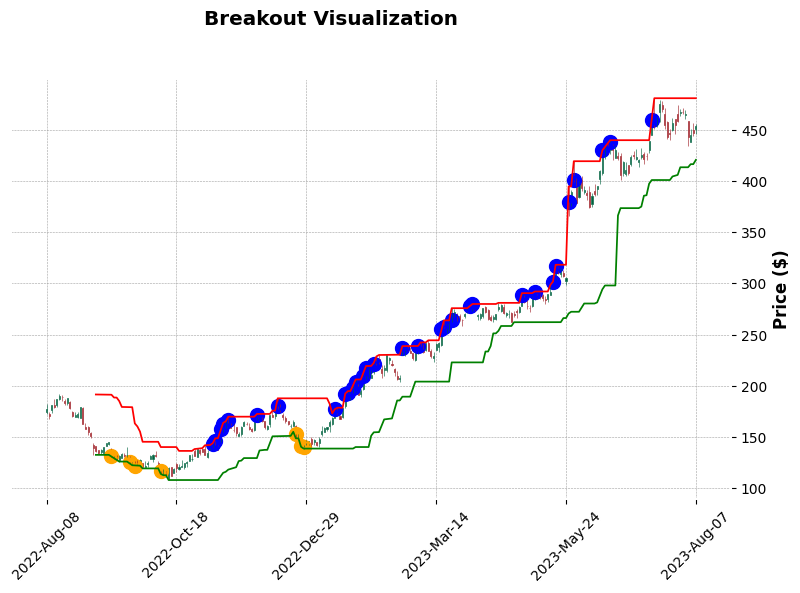
This visualization provides a clear picture of the price movements, support and resistance levels, and the points where bullish and bearish breakouts occur. It can be a valuable tool for traders looking to understand and capitalize on breakouts.
Validating Your Breakout Trading Strategy
After implementing your Breakout Trading (BT) strategy, it’s crucial to validate its effectiveness before risking any real capital. This is where backtesting comes into play. Backtesting is the process of testing a trading strategy using historical data, allowing traders to simulate trades and observe the performance of their strategy over time.
Importance of Backtesting in Trading
Backtesting plays a pivotal role in trading. It allows traders to simulate their strategy on historical data, providing insights into potential profitability and the risk associated with the strategy. By backtesting, traders can identify potential issues, estimate the profitability of their strategy, and gain confidence in their trading system.
How to Backtest Your BT Strategy Using Python
Python, with its powerful libraries like pandas and NumPy, provides an excellent environment for backtesting. Here’s a simple example of how you might backtest a BT strategy and visualize the cumulative strategy returns using a line plot:
# We'll create a 'Signal' column where we go long (1) on bullish breakouts and short (-1) on bearish breakouts
df['Signal'] = np.where(df['Bullish Breakout'], 1, np.where(df['Bearish Breakout'], -1, 0))

# Assume we invest the same amount of money in each trade
# Our daily returns are simply the change in price times our signal
df['Return'] = df['Signal'].shift() * df['close'].pct_change()

# The total strategy return is the cumulative product of our daily returns
df['Cumulative Return'] = (1 + df['Return']).cumprod() - 1

# Plot the cumulative returns
plt.figure(figsize=(10, 6))
plt.plot(df['Cumulative Return'])
plt.title('Cumulative Strategy Returns')
plt.show()

print('Final Strategy Return:', df['Cumulative Return'].iloc[-1])
In this code snippet, we first create a ‘Signal’ column in our DataFrame where we go long (1) on bullish breakouts and short (-1) on bearish breakouts. We then calculate our daily returns by multiplying our signal by the percentage change in the closing price. Finally, we calculate the total strategy return as the cumulative product of our daily returns and plot it using a line plot.
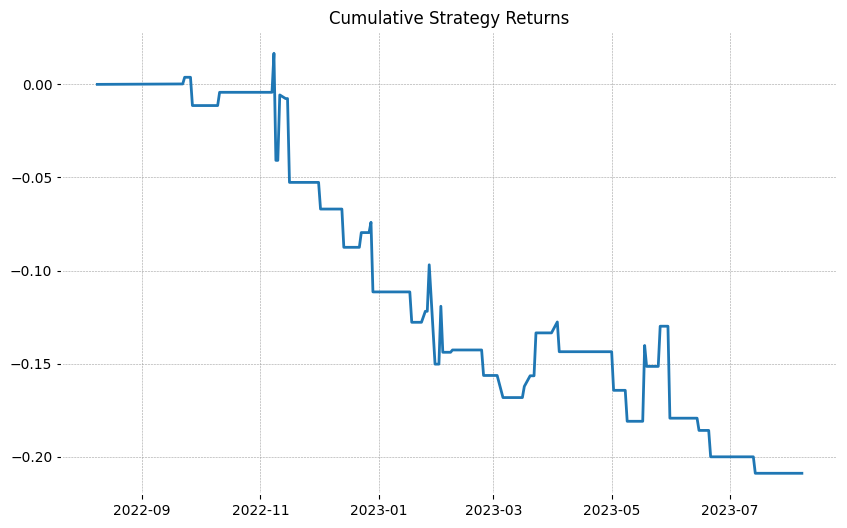
Final Strategy Return: -0.20886206305147736
Interpreting the Results of Your Backtest
The output of the backtest is the total return of the strategy over the backtesting period. A positive return indicates that the strategy would have been profitable over this period, while a negative return indicates a loss. However, it’s important to remember that past performance is not necessarily indicative of future results. A strategy that performed well in the past may not perform well in the future due to changes in market conditions.
Adjusting Your Strategy Based on Backtest Results
If your backtest results are not satisfactory, you may need to adjust your strategy. This could involve changing the parameters of your strategy, such as the length of the rolling window used to calculate support and resistance levels, or the criteria used to identify breakouts. You could also consider adding additional filters to improve the quality of the signals generated by your strategy. Remember, the goal of backtesting is not to create a strategy that performs perfectly on the historical data, but to create a robust strategy that is likely to perform well under a variety of future market conditions.
Risk Management in Breakout Trading
Risk management is a crucial aspect of any trading strategy, including Breakout Trading (BT). Even the most effective strategies can lead to significant losses if proper risk management techniques are not applied.
Importance of Risk Management in BT
BT involves entering trades when the price breaks through a support or resistance level. However, not all breakouts lead to a sustained price move in the breakout direction. Some breakouts fail, leading to a price reversal. Without proper risk management, these failed breakouts can result in substantial losses.
Techniques for Managing Risk in BT
There are several techniques for managing risk in BT:
- Setting Stop Losses: A stop loss is an order to sell a security when it reaches a certain price. It is designed to limit an investor’s loss on a security position.
- Position Sizing: This involves deciding how much of your portfolio to risk on any single trade. A common approach is to risk a fixed percentage of your portfolio on each trade.
- Diversification: This involves spreading your investments across various securities to reduce risk. In the context of BT, this could mean trading breakouts in different securities or sectors.
Implementing Risk Management Techniques in Python
Python can be used to implement these risk management techniques. Here’s an example of how you might set a stop loss and calculate position size in Python:
# Assume df is a DataFrame with 'Close' and 'Signal' columns
# We'll set our stop loss level 10% below our entry price
df['Stop Loss'] = np.where(df['Signal'] == 1, df['close'] * 0.9, np.where(df['Signal'] == -1, df['close'] * 1.1, np.nan))
df['Stop Loss'] = df['Stop Loss'].ffill()

# We'll exit our position if the price hits our stop loss level
df['Exit'] = np.where(df['Signal'] == 1, df['close'] < df['Stop Loss'], np.where(df['Signal'] == -1, df['close'] > df['Stop Loss'], False))

# We'll calculate our position size based on a fixed percentage of our portfolio
portfolio_size = 10000  # The size of our portfolio
risk_per_trade = 0.01  # We'll risk 1% of our portfolio on each trade
df['Position Size'] = portfolio_size * risk_per_trade / (df['close'] - df['Stop Loss']).abs()
In this code snippet, we first calculate our stop loss level as 10% below our entry price for long positions and 10% above our entry price for short positions. We then create an ‘Exit’ column that indicates whether the price has hit our stop loss level. Finally, we calculate our position size based on a fixed percentage of our portfolio.
Remember, risk management is not about avoiding losses entirely, but about limiting losses to a level that you are comfortable with. By applying these techniques, you can help ensure that your trading strategy is sustainable in the long run.
Conclusion
In this article, we’ve explored the Breakout Trading (BT) strategy, a popular approach among traders for identifying potential investment opportunities. We’ve delved into the intricacies of BT, understanding its application in different market scenarios, and how to identify potential breakouts.
We’ve also seen how Python, coupled with the EODHD API, can be a powerful tool for implementing BT. Python allows us to automate the process of identifying support and resistance levels, detecting breakouts, and even backtesting our strategy to validate its effectiveness.
However, it’s important to remember that trading is a continuous learning process. Market conditions change, and a strategy that works today may not work tomorrow. Therefore, it’s crucial to constantly monitor the performance of your strategy, adjust it as necessary, and always be on the lookout for new trading ideas.
Risk management is another critical aspect of trading. By setting stop losses, sizing your positions appropriately, and diversifying your trades, you can limit your potential losses and ensure that your trading strategy is sustainable in the long run.
Now it’s your turn. I encourage you to implement the BT strategy, backtest it, and see how it performs. Remember, the goal is not to create a perfect strategy, but to develop a robust one that can withstand various market conditions. Happy trading!