

When it comes to picking stocks, people often get caught up in the fancy charts and technical stuff. But there’s a quiet hero in the background that can make a big difference – it’s called Fundamental Analysis. It’s like understanding the ABCs of a company before making any big decisions.
Quick jump:
Getting Real with Fundamental Analysis
Sure, charts and trends look cool, but if you want to make real money in the long run, you’ve got to dig into the basics of a company. That’s where Fundamental Analysis comes in. It’s not about the stock market doing a dance; it’s about knowing how the company is doing financially.
Meet the EODHD Library: Your Backstage Pass to Company Secrets
Now, imagine you have a special pass that lets you peek behind the scenes of a company. That’s what the EODHD Library does. It gives you a ton of information about a company – like its report card, but for grown-ups. And this info is like gold for fundamental analysis.
The various details provided by the API can be explored with the Fundamentals API. Let’s dive into Fundamental Analysis with the Library! We’ll explore various aspects of fundamental analysis using the EODHD Library. This article will compare different companies based on their fundamentals, using examples to delve even deeper into the comparison between companies.
Importing the necessary packages
!pip install eodhd
from eodhd import APIClient


import pandas as pd
import matplotlib.pyplot as plt
import seaborn as snsPandas: This helps you work with data like a pro.
Matplotlib: Matplotlib is a comprehensive library for creating static, animated, and interactive visualizations in Python.
Seaborn: This one’s for creating cool graphs and charts.
eodhd: The official Python library of EODHD to access their APIs more conveniently
Extracting the data through various functions
The following code blocks define functions to extract various fundamental data for a given stock symbol using the EODHD API. Each function serves a specific purpose.
api_key = 'YOUR_API_KEY' #Enter your API KEY here
#Making a EODHD Client
client = APIClient(api_key)


def extract_fundamentals(symbol):
    # Purpose: Get overall fundamental data for a stock symbol.
    raw_df = client.get_fundamentals_data(symbol)

    df = pd.DataFrame(raw_df)
return dfThe function extract_fundamentals extracts all the fundamental data of the company whose symbol is provided as input. Specific data is obtained by further getting into this endpoint of the API. All the fundamental data can be extracted from this endpoint.
def extract_valuation(symbol):
    # Purpose: Retrieve valuation-related information for a stock symbol.
    raw_df = client.get_fundamentals_data(symbol)
    df = pd.DataFrame([raw_df['Valuation']])
    return df

extract_valuation(‘TSLA’)
The function extract_valuation extract the valuation-related information for a particular stock. This is the output of the above code:

If you’re not familiar with what each of the columns means, don’t worry. Here’s an explanation of all the terms you need to know for a better understanding of the output dataframe:
- Trailing P/E (Price-to-Earnings) Ratio: This ratio is calculated by dividing the current stock price by the earnings per share (EPS) over the past 12 months. It gives investors an idea of how much they are willing to pay for a company’s past earnings.
- Forward P/E Ratio: Similar to the trailing P/E ratio, but instead of using past earnings, it uses estimated future earnings. It provides a measure of the expected future earnings growth of a company.
- Price-to-Sales (P/S) Ratio (TTM – Trailing Twelve Months): This ratio is calculated by dividing the current market price per share by the revenue per share over the past 12 months. It gives an indication of how much investors are willing to pay for each dollar of sales generated by the company.
- Price-to-Book (P/B) Ratio (MRQ – Most Recent Quarter): The P/B ratio compares a company’s current market price to its book value (assets minus liabilities). It’s a measure of how the market values the company relative to its net asset value.
- Enterprise Value: Enterprise value is a measure of a company’s total value, including its market capitalization, debt, and cash. It provides a more comprehensive view of a company’s total worth than market capitalization alone.
- Enterprise Value to Revenue Ratio: This ratio is calculated by dividing the enterprise value by the company’s revenue. It provides an alternative perspective on valuation by considering the total value of the company in relation to its revenue.
- Enterprise Value to EBITDA (Earnings Before Interest, Taxes, Depreciation, and Amortization) Ratio: This ratio compares the enterprise value to the company’s EBITDA. It is used to assess a company’s operating performance and is often used in acquisition analysis.
def extract_balancesheet_quarterly(symbol):
    # Purpose: Fetch quarterly balance sheet data for a stock symbol.
    raw_df= client.get_fundamentals_data(symbol)
    df = pd.DataFrame(raw_df['Financials']['Balance_Sheet']['quarterly']).T
    return df
The function extract_balancesheet_quarterly extract the information quarterly (every 3 months, you can also explore the yearly part from the API).
def extract_earning_trends(symbol):
    # Purpose: Collect earning trends data for a stock symbol.
    raw_df= client.get_fundamentals_data(symbol)


    df = pd.DataFrame(raw_df['Earnings']['Trend']).T
    return df
The function extract_earning_trends gives the following data for a company which is mostly related to earning insights of a company:
- Growth: Indicates the percentage growth.
- Earnings Estimate Avg: The average earnings estimate.
- Earnings Estimate Low/High: The low and high estimates for earnings.
- Earnings Estimate Year Ago EPS: Earnings per share from the same period in the previous year.
- Earnings Estimate Number Of Analysts: The number of analysts providing estimates.
- Earnings Estimate Growth: The growth rate of earnings estimates.
- Revenue Estimate Avg: The average revenue estimate.
- Revenue Estimate Growth: The growth rate of revenue estimates.
- EPS Trend (Current, 7 days ago, 30 days ago, 60 days ago, 90 days ago): Trends in earnings per share estimates over different time frames.
- EPS Revisions (Up/Down) Last 7 days and 30 days: The number of times earnings estimates were revised up or down by analysts in the specified period.
def extract_analystR(symbol):
    # Purpose: Extract analyst ratings for a stock symbol.
    raw_df= client.get_fundamentals_data(symbol)
    df = pd.DataFrame([raw_df['AnalystRatings']])
    return df

extract_analystR('TSLA')
The extract_analystR function can be used to obtain the recommendations and advice of analysts on a particular stock. This is the output of the above code:

Here’s an explanation of all the various fields in the output dataframe:
- Strong Buy: Exceptional performance expected.
- Buy: Positive outlook; recommend buying.
- Hold: Neutral stance; performance stability.
- Sell: Anticipated decline; recommend selling.
- Strong Sell: Strong belief in underperformance.
- Target Price: Analysts estimate a fair future value for the stock, aiding investors in assessing potential upsides or downsides.
def extract_highlights(symbol):
    # Purpose: Retrieve highlights data for a stock symbol.
    raw_df= client.get_fundamentals_data(symbol)
    df = pd.DataFrame([raw_df['Highlights']])
    return df
Some of the data obtained from the function extract_highlights are:
- Market Capitalization: Total market value of a company’s outstanding shares.
- EBITDA (Earnings Before Interest, Taxes, Depreciation, and Amortization): Indicator of operating performance.
- PE Ratio (Price-to-Earnings Ratio): Measures stock’s valuation relative to earnings.
- PEG Ratio (Price/Earnings to Growth Ratio): Evaluates stock valuation considering earnings growth.
- Wall Street Target Price: Analysts’ estimated future stock price.
- Book Value: Net asset value of a company’s shares.
- Dividend Share & Dividend Yield: Cash paid per share and yield based on the dividend.
- Earnings Share: The company’s profit distributed to each outstanding share.
- Profit Margin & Operating Margin TTM (Trailing Twelve Months): Measures profitability.
- Return on Assets and Return on Equity TTM: Indicate company efficiency in using assets and equity.
- Revenue TTM (Trailing Twelve Months) & Revenue Per Share TTM: Total revenue and revenue per share.
- Quarterly Revenue Growth YoY (Year-over-Year): Growth in revenue compared to the same quarter in the previous year.
- Gross Profit TTM: Total revenue minus the cost of goods sold.
- Diluted EPS TTM: Earnings per share, accounting for all potential dilution.
- Quarterly Earnings Growth YoY: Growth in earnings compared to the same quarter in the previous year.
def extract_technicals(symbol):
    # Purpose: Get technicals-related information for a stock symbol.
    raw_df= client.get_fundamentals_data(symbol)
    df = pd.DataFrame([raw_df['Technicals']])
    return df


extract_technicals('TSLA')
The various information obtained from the function extract_technicals are:
- Beta: Measures a stock’s volatility compared to the overall market. A beta of 1 implies the stock moves with the market; below 1 indicates less volatility, and above 1 indicates higher volatility.
- 52-Week High & 52-Week Low: The highest and lowest prices a stock has reached in the past 52 weeks, indicating its historical price range.
- 50-Day Moving Average (50DayMA) & 200-Day Moving Average (200DayMA): Averages of a stock’s closing prices over the last 50 and 200 days, respectively. Used to identify trends and potential support/resistance levels.
- Shares Short & Shares Short Prior Month: Number of shares investors have sold short (betting the stock price will fall) during the current and previous months.
- Short Ratio: Days it would take for short sellers to cover their positions based on the average daily trading volume, indicating potential pressure on the stock.
- Short Percent: Percentage of outstanding shares held short, providing insight into investor sentiment and potential for short squeezes.
Here’s the output of the function extract_technicals:

The following code dynamically generates variables for each stock symbol, appending different suffixes based on the type of data extracted. The globals() function is used to create these variables at the global scope, allowing them to be accessed outside the loop. The resulting variables store dataframes containing various financial information for each stock symbol.
# Given list of stock symbols
stock_list = ['TSLA', 'IBM', 'MSFT', 'AAPL']


# Loop through each stock symbol and dynamically create variables using globals()
for i in stock_list:
  globals()[i + '_fundamental'] =extract_fundamentals(i)
  globals()[i + '_valuation'] =extract_valuation(i)
  globals()[i + '+_balancesheet_quarterly'] =extract_balancesheet_quarterly(i)
  globals()[i + '_earning_trends'] =extract_earning_trends(i)
  globals()[i + '_esgscores'] =extract_esgscores(i)
  globals()[i + '_analystR'] =extract_analystR(i)
  globals()[i + '_highlights'] =extract_highlights(i)
  globals()[i + '_technicals'] =extract_technicals(i)
Visualizing the fundamentals of various companies
Now, let’s compare companies on different fundamentals to gain better insights. We’ll use Seaborn to create line plots for fundamentals like valuation and analyst ratings.
# Concatenate the dataframes
valuation_df = pd.concat([IBM_valuation, Tsla_valuation, AAPL_valuation, MSFT_valuation]).reset_index()
analyst_df = pd.concat([IBM_analystR, Tsla_analystR, AAPL_analystR, MSFT_analystR]).reset_index()
highlights_df = pd.concat([IBM_highlights, Tsla_highlights, AAPL_highlights, MSFT_highlights]).reset_index()
technicals_df = pd.concat([IBM_technicals, Tsla_technicals, AAPL_technicals, MSFT_technicals]).reset_index()

valuation_df
Output:
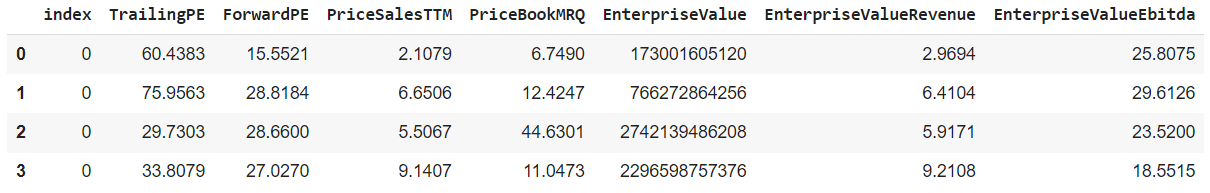
# Set the style of seaborn
sns.set(style="whitegrid")
# Create the first line plot
sns.lineplot(x = valuation_df.index, y=valuation_df['EnterpriseValue'])


plt.show()
Output:
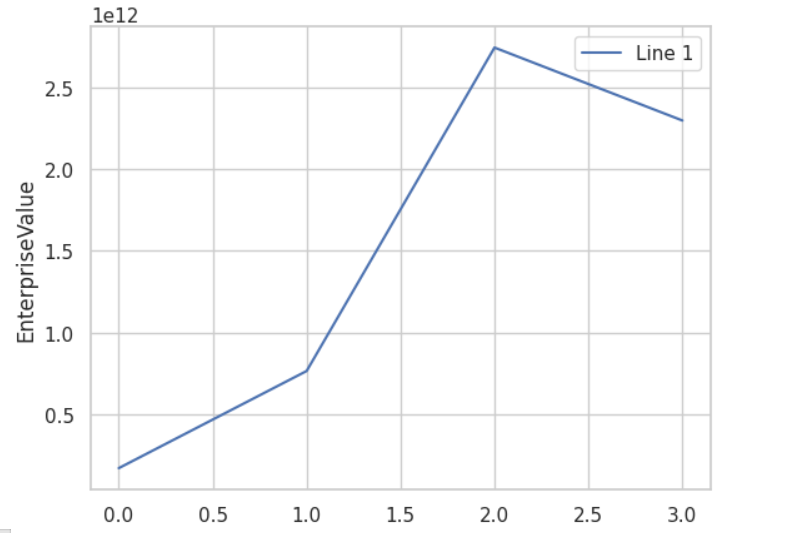
Comparing the enterprise value of IBM, Tesla, Apple, and Microsoft, we got to know that Apple’s total value, including its market capitalization, debt, and cash is more than the rest of them, and IBM’s is least.
display(analyst_df)Output:
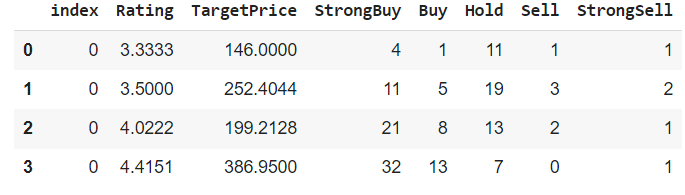
sns.lineplot(x =analyst_df.index, y=analyst_df['Rating'],label='Line 2')Output:
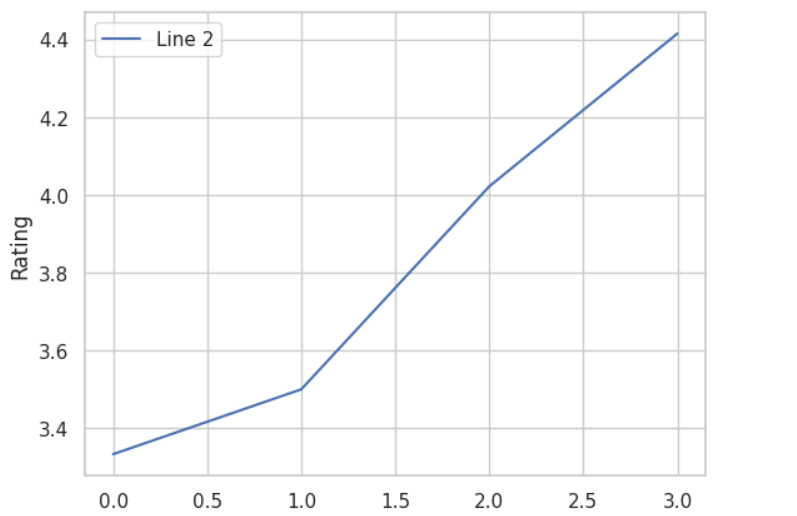
The curve suggests that analysts suggested trading Microsoft’s stocks more than the rest of them.
display(highlights_df)Output:
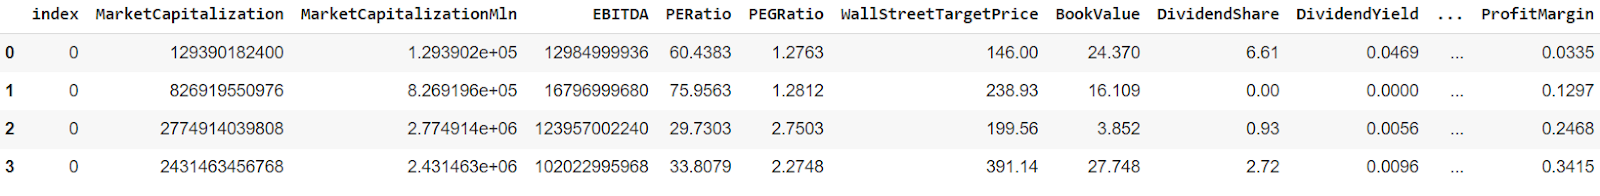
sns.lineplot(x =highlights_df.index, y=highlights_df['PERatio'],label='Line 3')Output:
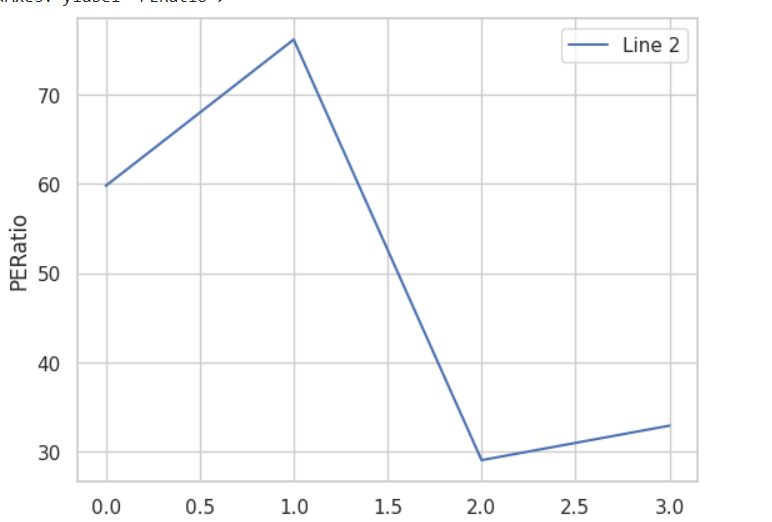
PE Ratio (Price-to-Earnings Ratio) measures the stock’s valuation relative to earnings. The curve suggests that the price-to-earning ratio of Tesla is greater than the rest of the companies.
sns.lineplot(x =highlights_df.index, y=highlights_df['EBITDA'],label='Line 4')Output:
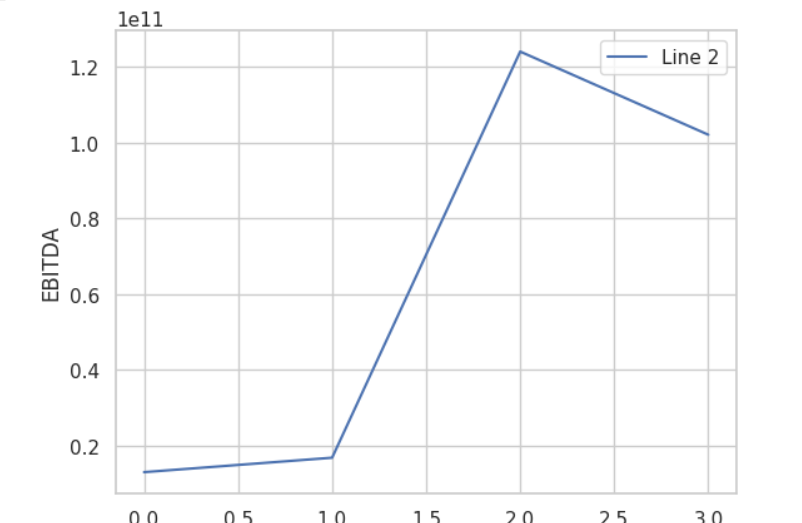
EBITDA (Earnings Before Interest, Taxes, Depreciation, and Amortization) is an indicator of operating performance. Then we can say that the operating performance of Apple is better than the three companies.
Conclusion: Your Fundamental Toolkit for Smart Investing
So, next time you’re checking out the stock market, don’t just get lost in the flashy stuff. Take a moment to understand the basics, and let the EODHD API be your guide. With fundamental analysis as your sidekick and the EODHD API in your toolkit, you’re not just investing; you’re making smart decisions. Happy investing!