

In this article, we will delve into Trading Comps analysis, a fundamental aspect of financial evaluation in the realm of investments. Our focus will be on describing the characteristics and advantages of this approach and provide practical insights by showcasing a real-world application using Python.
A Trading Comparable Analysis is a valuation method used in finance to estimate the value of a company by comparing it to the valuation multiples of similar publicly traded companies. The idea is to use the market prices and financial statement data of comparable companies as a benchmark to assess the fair market value of the company being analyzed.
Unlike the Discounted Cash Flow model described in a previous article, Trading Comps is a relative valuation method that assesses a company’s value by comparing it to a group of peers. This approach assumes that comparable companies are fairly valued by the market. While DCF provides a detailed and flexible analysis, Trading Comps offers a snapshot of the current market sentiment by relying on observed market multiples. Analysts often use a combination of these methods to obtain a comprehensive understanding of a company’s valuation. Each approach has its strengths and is suited to different circumstances.

An example: Tesla Inc.
To illustrate the application of the analysis method, we first need to establish an objective company and create a list of peers for comparison. To maintain consistency with the previous article, we will continue to analyse Tesla as the chosen company. Despite the challenge of identifying direct peers for Tesla due to its unique nature, we will consider a basket of large-cap technology and automotive U.S. stocks for comparison: General Motors (GM), Google (GOOGL), Amazon (AMZN), Tencent Holdings (TCEHY), Intel Corporation (INTC), Apple (AAPL), and Ford (F).
Following the approach of previous articles, we will utilize the Python EOD Library to retrieve fundamental data for stocks using the client.get_fundamental_equity function. This package provides excellent versatility and ease of use, making it an ideal choice for extracting companies’ prices and financial statement data. We begin by importing income statement data for our target firm and all companies in our comparison universe.
1. Use the “demo” API key to test our data from a limited set of tickers without registering: AAPL.US | TSLA.US | VTI.US | AMZN.US | BTC-USD | EUR-USD
Real-Time Data and all of the APIs (except Bulk) are included without API calls limitations with these tickers and the demo key.
2. Register to get your free API key (limited to 20 API calls per day) with access to: End-Of-Day Historical Data with only the past year for any ticker, and the List of tickers per Exchange.
3. To unlock your API key, we recommend to choose the subscription plan which covers your needs.
stock = "TSLA.US"
peers = ["GM.US", "GOOGL.US", "AMZN.US", "TCEHY.US", "INTC.US", "AAPL.US", "F.US"]
df_fund = pd.DataFrame()
all_ticks = [stock] + peers
for tick in all_ticks:
print(tick)
inc_stat = client.get_fundamental_equity(tick, filter_='Financials::Income_Statement::yearly')
df_temp = pd.DataFrame.from_dict(inc_stat, orient="index").sort_index()
df_temp.index = pd.to_datetime(df_temp.index).year.astype(str)
df_temp["ticker"] = tick
df_temp = df_temp.set_index([df_temp["ticker"], df_temp.index])
df_fund= pd.concat([df_fund, df_temp],axis = 0)
df_fund = df_fund.replace(to_replace={None: np.nan, type(None): np.nan}, inplace=False)
df_fund.index.names = ["ticker", "year"]Then we compute three key metrics for the trading comps analysis:
- Revenue Growth measures the percentage increase in a company’s revenue over a specific period. A positive revenue growth indicates the company’s ability to increase its sales, reflecting positive market demand and potential business expansion.
- EBITDA Margin represents the proportion of a company’s revenue that translates into EBITDA. It is calculated by dividing EBITDA by total revenue. EBITDA margin is a valuable indicator of operational efficiency, as it shows the company’s ability to generate earnings from its core business operations, excluding certain non-operating expenses.
- Profit Margin measures the percentage of revenue that translates into net profit after deducting all operating expenses, interest, and taxes. It is a key indicator of a company’s profitability and cost management. A higher profit margin indicates effective cost control and operational efficiency.
Also, we focus on the last three year of data and filter out information reported before 2020. Note that certain companies may operate on a fiscal year not ending on December 31st. In such cases, there might be a mismatch as we compare data from yearly reports released at different points in time. To avoid this issue, we suggest replacing yearly with quarterly in the query above.
df_fund = df_fund[["totalRevenue", "netIncome", "ebitda"]].astype(float)
df_fund["revGrowth"] = df_fund.groupby("ticker")["totalRevenue"].pct_change()
df_fund["ebitdaMargin"] = df_fund["ebitda"] / df_fund["totalRevenue"]
df_fund["profitMargin"] = df_fund["netIncome"] / df_fund["totalRevenue"]
df_fund = df_fund[df_fund.index.get_level_values(1) != "2023"] ## adjust fiscal year
df_last = df_fund.groupby(level=['ticker']).tail(3)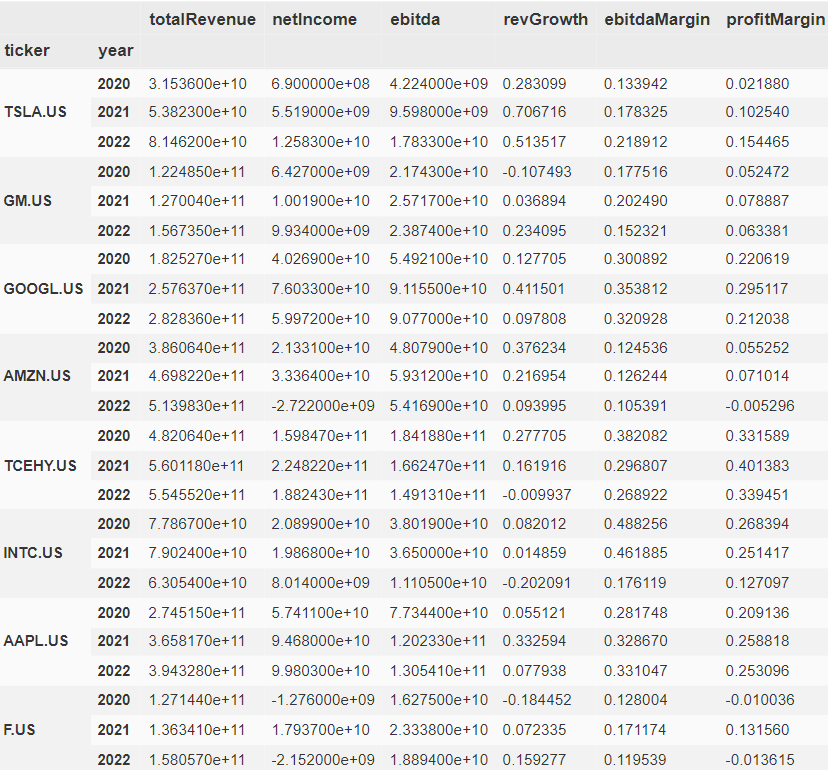
Before proceeding to the peer comparison, we need to gather additional data. Specifically, we will retrieve our target company’s market capitalization and enterprise value (EV), as these values will be used in computing the trading multiples.
df_data = pd.DataFrame(index =all_ticks)
marketCap = np.zeros(len(all_ticks))
enterpriseValue = np.zeros(len(all_ticks))

c = 0
for tick in all_ticks:
    print(tick)
    marketCap[c] =  client.get_fundamental_equity(tick, filter_='Highlights::MarketCapitalization')
    enterpriseValue[c] = client.get_fundamental_equity(tick, filter_='Valuation::EnterpriseValue')
    c+=1

df_data["marketCap"] = marketCap
df_data["enterpriseValue"] = enterpriseValue
df_all = pd.merge(df_data, df_last.reset_index(level=1, drop=False), left_index=True, right_index=True)
df_all = df_all.set_index([b.index, "year"])
df_all.index.names = ["ticker", "year"]Trading Multiples
Trading multiples, also known as valuation multiples or financial ratios, are metrics used in financial analysis to compare the valuation of a company’s stock relative to its financial performance or certain fundamental indicators. Although there are numerous ratios employed in equity research and financial analysis, three primary ones, as illustrated in this example, include:
- Price-to-Earnings (P/E) compares a company’s stock price to its earnings per share (EPS). It reflects investors’ expectations of a company’s future earnings growth.
- Enterprise Value-to-EBITDA (EV/EBITDA) compares a company’s enterprise value (market value of equity plus debt minus cash) to its Earnings Before Interest, Taxes, Depreciation, and Amortization (EBITDA).
- Enterprise Value-to-Revenue assess how the market values a company’s revenue-generating capacity. A higher ratio may indicate that the market values the company’s revenue more favorably, while a lower ratio may suggest a more conservative valuation relative to revenue.
df_all["EVofRevenue"] = df_all["enterpriseValue"] / df_all["totalRevenue"]
df_all["EVofEbitda"] = df_all["enterpriseValue"] / df_all["ebitda"]
df_all["PofE"] = df_all["marketCap"] / df_all["netIncome"]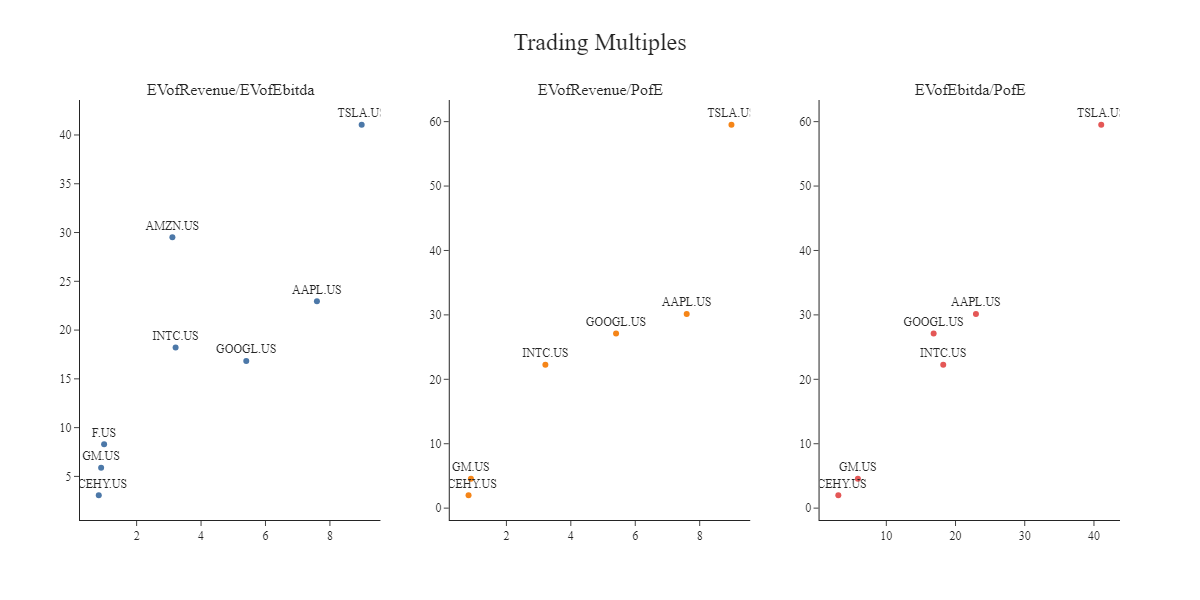
With our valuation metrics for each company, we can now compute statistics for the entire peers’ universe. This will assist us in visualizing where the target company falls within the distribution of its peers in relation with the group’s mean, median, maximum and minimum values. Higher P/E multiples than those of peers suggest that investors are paying more for the company’s earnings. The same logic applies to the other two ratios. This would indicate that the company may be overpriced and not represent a good investment opportunity.
df_comp = df_all[["totalRevenue", "ebitda", "netIncome", "revGrowth", "ebitdaMargin", "profitMargin", "EVofRevenue", "EVofEbitda", "PofE"]].unstack(level='year')
df_comp.loc["Minimum", :] = df_comp.min()
df_comp.loc["Mean", :] = df_comp.mean()
df_comp.loc[" Median", :] = df_comp.median()
df_comp.loc["Maximum", :] = df_comp.max()
df_comp.loc[:, "revGrowth":]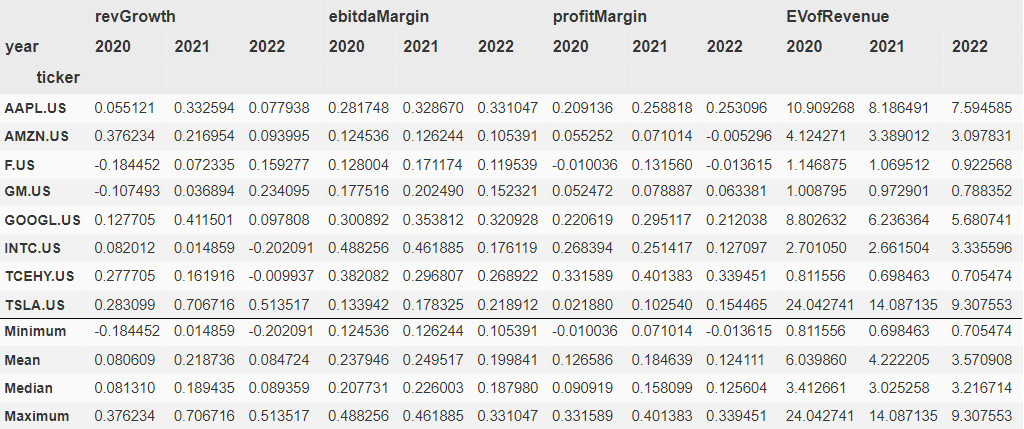
year = "2022"
df_comp.columns = df_comp.columns.map('_'.join)
df_comp = df_comp.loc[:, df_comp.columns.str.contains(year)]
df_comp.columns = [i[:-5] for i in df_comp.columns]
As the last step, we calculate the implied share prices for the target company using the group statistics and Tesla’s latest financial statement data. This can provide us with ranges for where Tesla’s price could be if its multiples were the lowest, highest, or around the mean within its peer group. To do that, we will first derive new estimates for EV based on Revenue and EBITDA.
outshares = client.get_fundamental_equity(stock, filter_='SharesStats::SharesOutstanding')
df_price = df_comp.loc["Minimum":, "EVofRevenue":]
# Financial metric
df_price[stock[:-3]+"_revenue"] = df_comp.loc[stock, "totalRevenue"]
df_price[stock[:-3]+"_ebitda"] = df_comp.loc[stock, "ebitda"]
df_price["EPS"] = df_comp.loc[stock, "netIncome"] / outshares
# Enterprise Value
df_price["EV_revenue"] = df_price[stock[:-3]+"_revenue"] *df_price["EVofRevenue"]
df_price["EV_ebitda"] = df_price[stock[:-3]+"_ebitda"] *df_price["EVofEbitda"]
To derive the Implied Share Price from the Enterprise Value, the first step is to compute the Equity Value, which represents the residual interest in the assets of a company after deducting liabilities. The formula is:

and then divide this quantity by the number of outstanding common shares. This will give us a range of prices for Tesla based on the three metrics: Revenue, EBITDA and Net Income of similar public companies companies
bs = client.get_fundamental_equity(stock, filter_='Financials::Balance_Sheet::yearly')
df_price["cash"] = float(pd.DataFrame(bs).loc["cash"].values[0])
df_price["debt"] = float(pd.DataFrame(bs).loc["totalLiab"].values[0])
df_price["outshares"] = outshares
df_price["EQ_revenue"] = df_price["EV_revenue"] +  df_price["cash"] - df_price["debt"]

df_price["EQ_ebitda"] = df_price["EV_ebitda"] +  df_price["cash"] - df_price["debt"]
df_price["EQ_netIncome"] = df_price["PofE"] *  df_price["EPS"] * df_price["outshares"]

df_price["ISP_revenue"] = df_price["EQ_revenue"] / df_price["outshares"]
df_price["ISP_ebitda"] = df_price["EQ_ebitda"] / df_price["outshares"]
df_price["ISP_netIncome"] = df_price["EQ_netIncome"] / df_price["outshares"]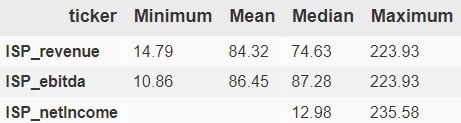
Conclusion
In conclusion, the analysis of Tesla through trading comps provides valuable insights into the company’s relative valuation within the automotive and tech industry. By comparing key financial metrics and multiples with those of its peers, we gain a comprehensive understanding of Tesla’s market position and investor sentiment. The examination of trading multiples such as Price-to-Earnings (P/E), Enterprise Value-to-EBITDA (EV/EBITDA), and Price-to-Earnings (P/E) sheds light on Tesla’s valuation relative to its earnings, operational efficiency, and revenue generation. While the analysis underscores Tesla’s remarkable growth and market dominance, it also emphasizes the importance of considering various factors, such as industry dynamics and growth prospects, for a complete evaluation. As Tesla continues to shape the future of electric vehicles and sustainable energy, this trading comps analysis serves as a valuable tool for investors seeking to make informed decisions in the dynamic landscape.