

There are two practical ways to get stock prices in Excel in 2026, and you can combine them in the same workbook.
The EODHD Excel Add-on loads end-of-day history, intraday bars, live (delayed) prices, full fundamentals and technical indicators into your sheet without formulas. And for a single value that has to live in a cell, such as the last price or the P/E ratio of a stock, one WEBSERVICE formula pointed at the EODHD API is enough.
This guide walks through both, with the forms, formulas and results I got when I ran each request on October 29, 2026.
Quick jump:
- 1 Preparations: installing the EODHD Excel Add-on
- 2 How to get your EODHD API key
- 3 Historical stock prices in Excel with the Add-on
- 4 Intraday stock prices in Excel with the Add-on
- 5 Live (delayed) stock prices in Excel with the Add-on
- 6 Fundamentals with the Add-on
- 7 Technical indicators with the Add-on
- 8 Dividends
- 9 Live stock prices in an Excel cell with WEBSERVICE
- 10 Example: four demo tickers in one Excel sheet
- 11 Practical notes for WEBSERVICE formulas
- 12 Historical stock prices and dividends in Excel with WEBSERVICE
- 13 Bulk downloads with the EODHD VBA workbook
- 14 Which method to use for stock prices in Excel
- 15 Conclusion
- 16 FAQs
Preparations: installing the EODHD Excel Add-on
The EODHD Excel Add-on runs on Excel for Windows. It works without formulas: you pick the data type on a ribbon tab, fill in a short form, and the add-on writes the result into a new worksheet as a formatted table.
- Download the installer from the Excel Add-on documentation page and run it.
- Then open Excel. A new ribbon tab called EODHD APIs appears, along with an Info panel.
- Click API key in the Info panel, paste your key and click Save.
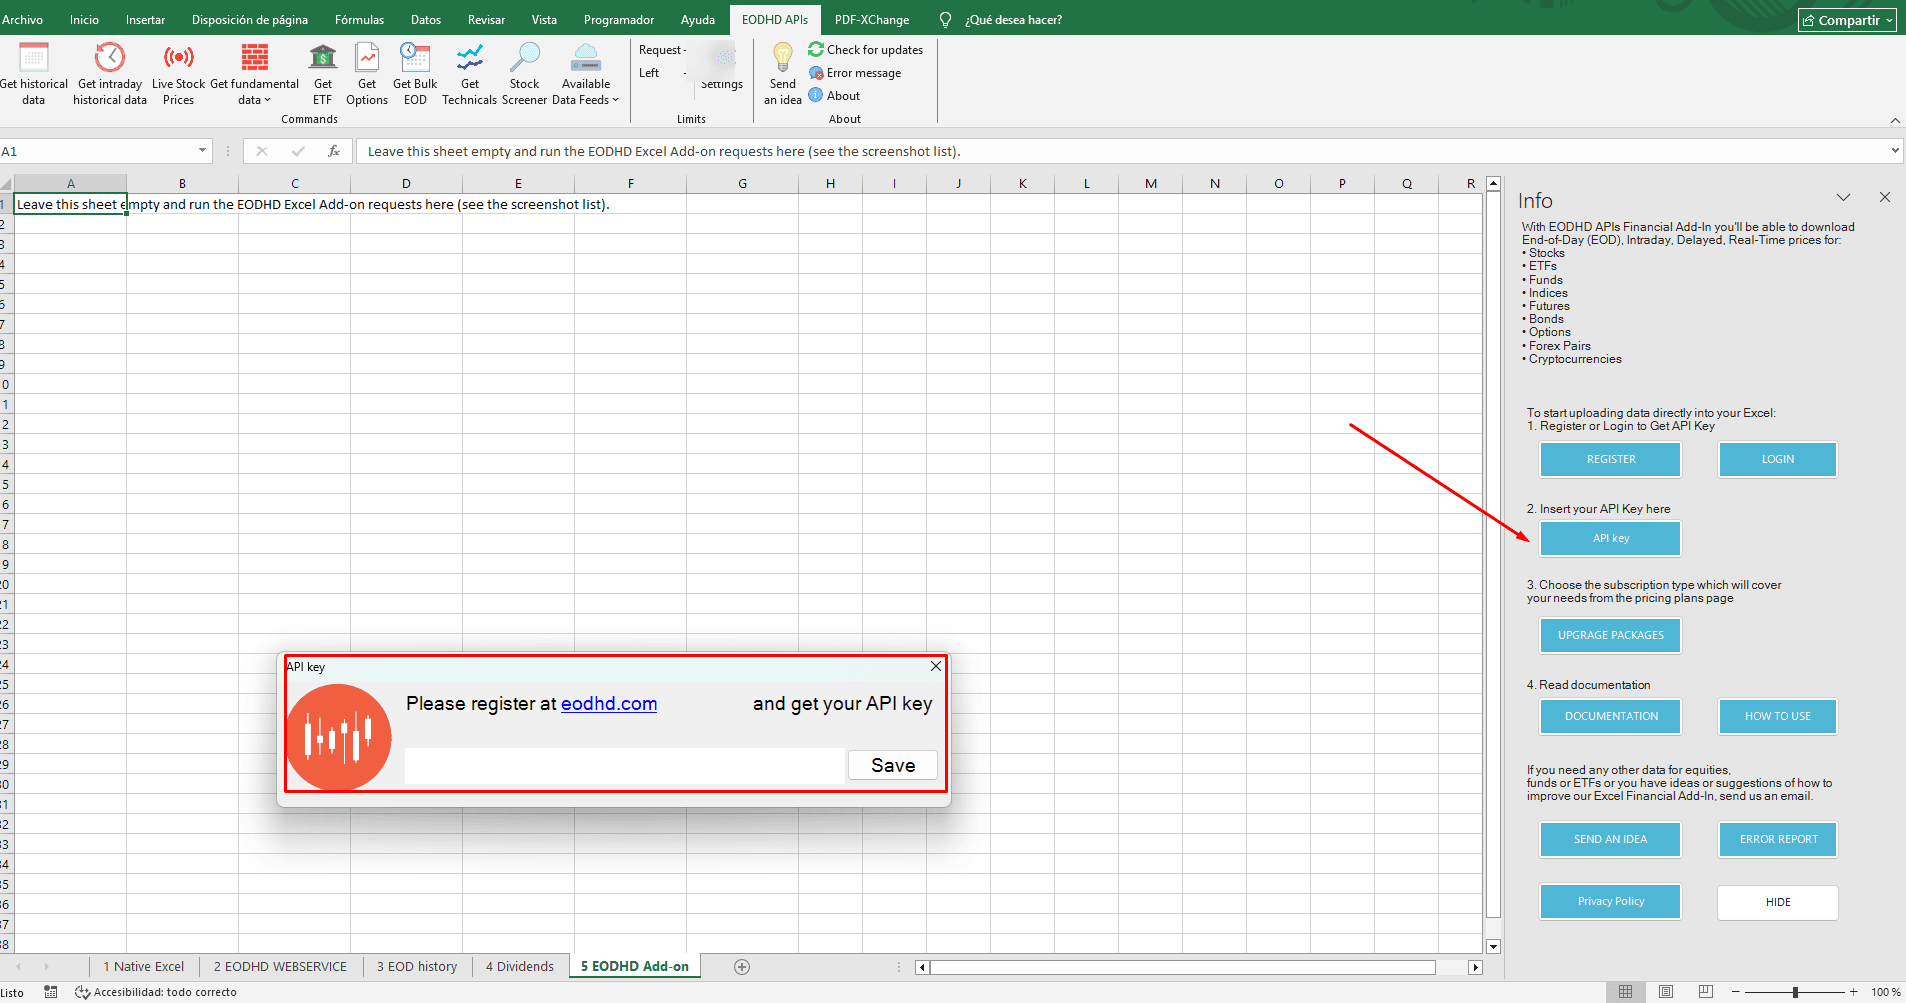
The Commands group holds one button per data type: Get historical data, Get intraday historical data, Live Stock Prices, Get fundamental data, Get ETF, Get Options, Get Bulk EOD, Get Technicals and Stock Screener. Available Data Feeds lists exchanges, cryptocurrencies and forex pairs. The Limits group shows Request and Left counters for your API usage.
Google Sheets users on Windows, Mac or Linux can use the EODHD Google Sheets add-on instead.
How to get your EODHD API key
1. Use the “demo” API key to test our data from a limited set of tickers without registering:
AAPL.US | TSLA.US | VTI.US | AMZN.US | BTC-USD | EUR-USD
Real-Time Data and all of the APIs (except Bulk) are included without API calls limitations with these tickers and the demo key.
2. Register to get your free API key (limited to 20 API calls per day) with access to:
End-Of-Day Historical Data with only the past year for any ticker, and the List of tickers per Exchange.
3. To unlock your API key, we recommend to choose the subscription plan which covers your needs.
Historical stock prices in Excel with the Add-on
First, click Get historical data. The Historical data form opens.
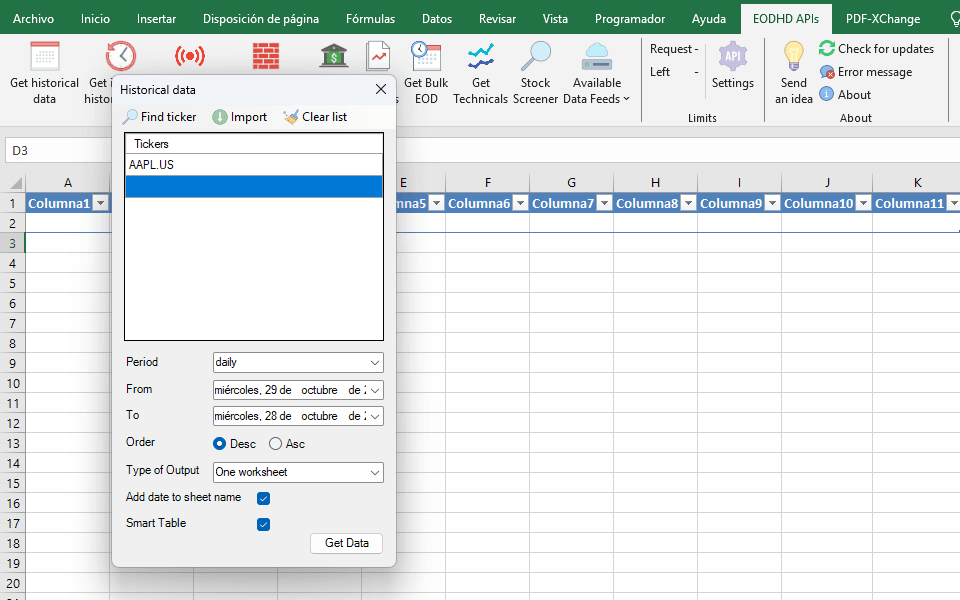
- Type the ticker in the Tickers list with its exchange code, for example AAPL.US. The form also has Find ticker, Import and Clear list buttons above the list.
- Choose the Period (daily is the default), then the From and To dates. By default the form covers the last year.
- Leave Type of Output on One worksheet and keep Smart Table checked to get an Excel table you can filter and sort.
- Click Get Data.
Then the add-on creates a new worksheet with one row per trading day. For AAPL.US it returned these columns: Ticker, Date, Open, High, Low, Close, Adjusted open, Adjusted high, Adjusted low, Adjusted close and Volume.
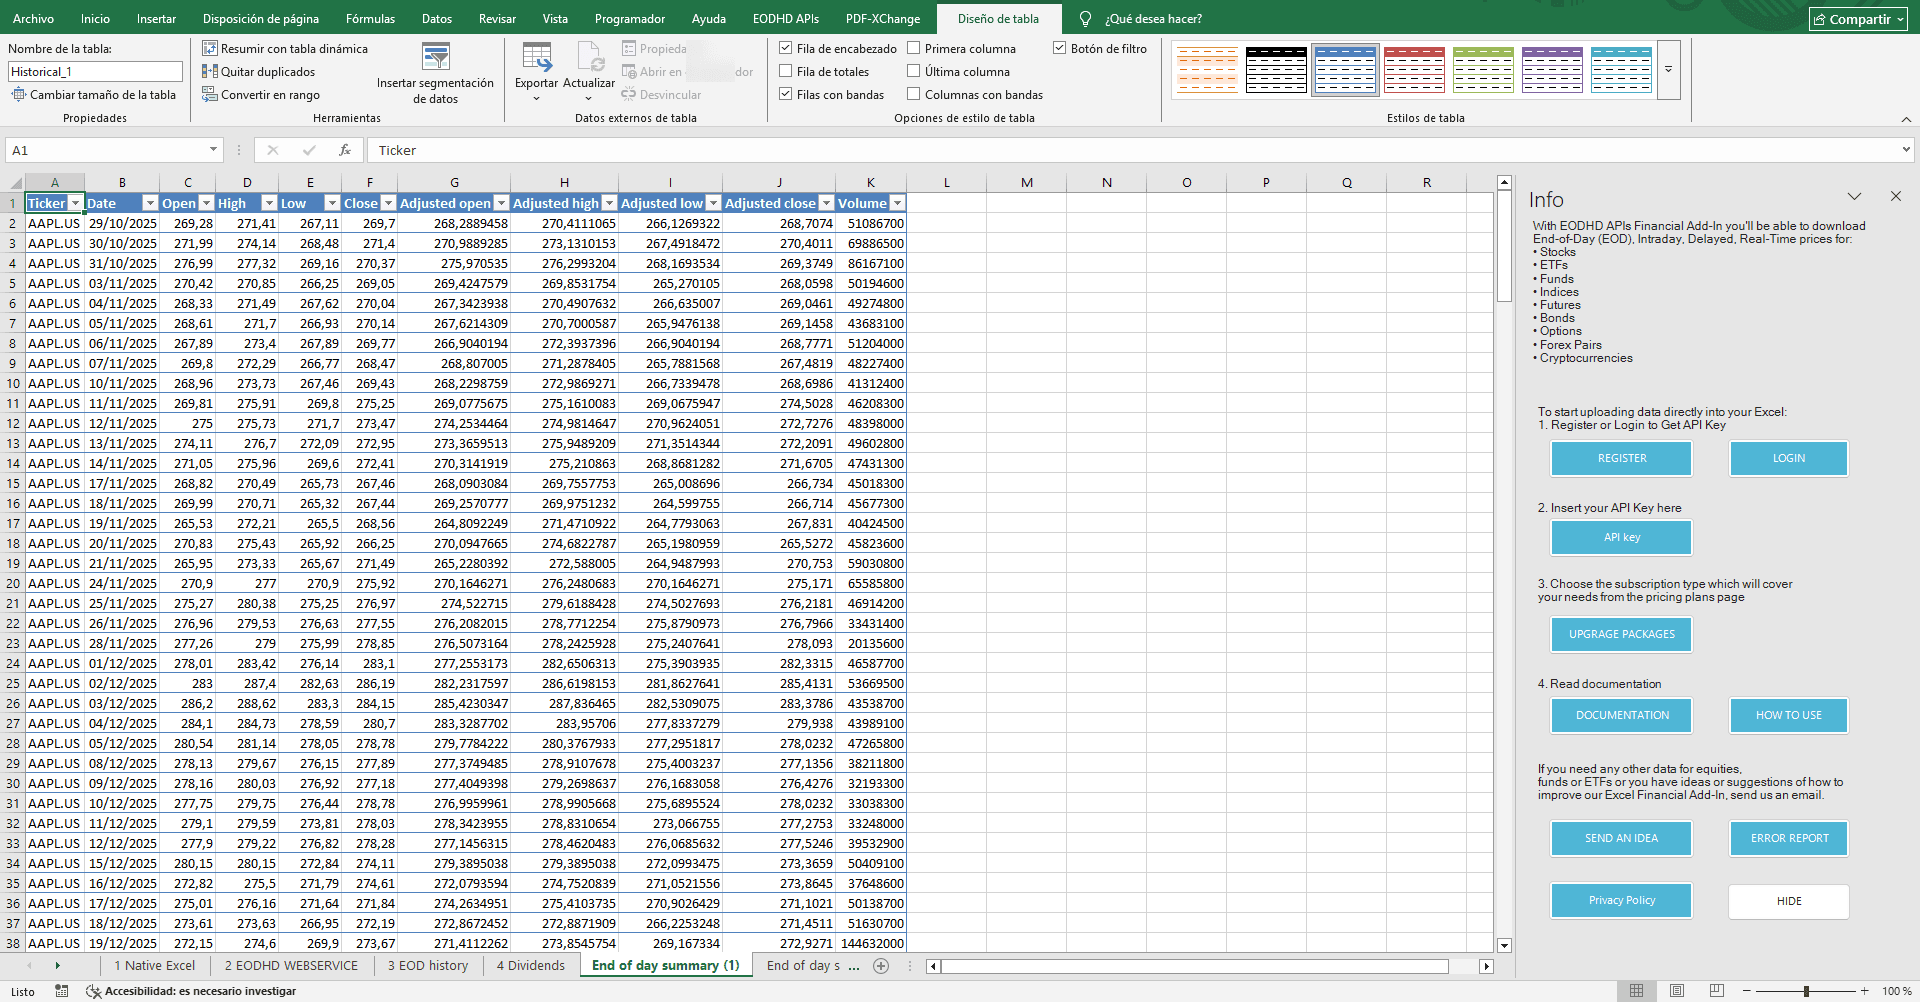
Close is the traded price. For returns over long periods, however, use Adjusted close, which is adjusted for splits and dividends.
In addition, the depth of history depends on your plan. The free plan includes one year of end-of-day prices, and the EOD Historical All-World plan includes 30+ years.
Intraday stock prices in Excel with the Add-on
Next, Get intraday historical data opens the Intraday Historical Data form. It works like the historical form, with an Interval list instead of Period: 1m, 5m, 15m, 30m and 1h.
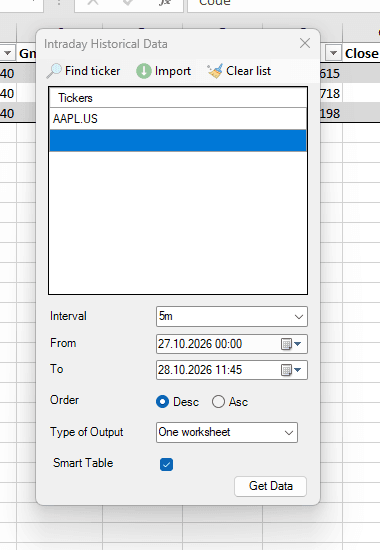
The From date defaults to 01.01.1970, so set a short range before you click Get Data. A single session of 5-minute bars is plenty for a first test. I requested AAPL.US from 27.10.2026 00:00 with a 5m interval. The add-on returned 79 bars, from 13:30 to 20:00 on October 27, 2026.
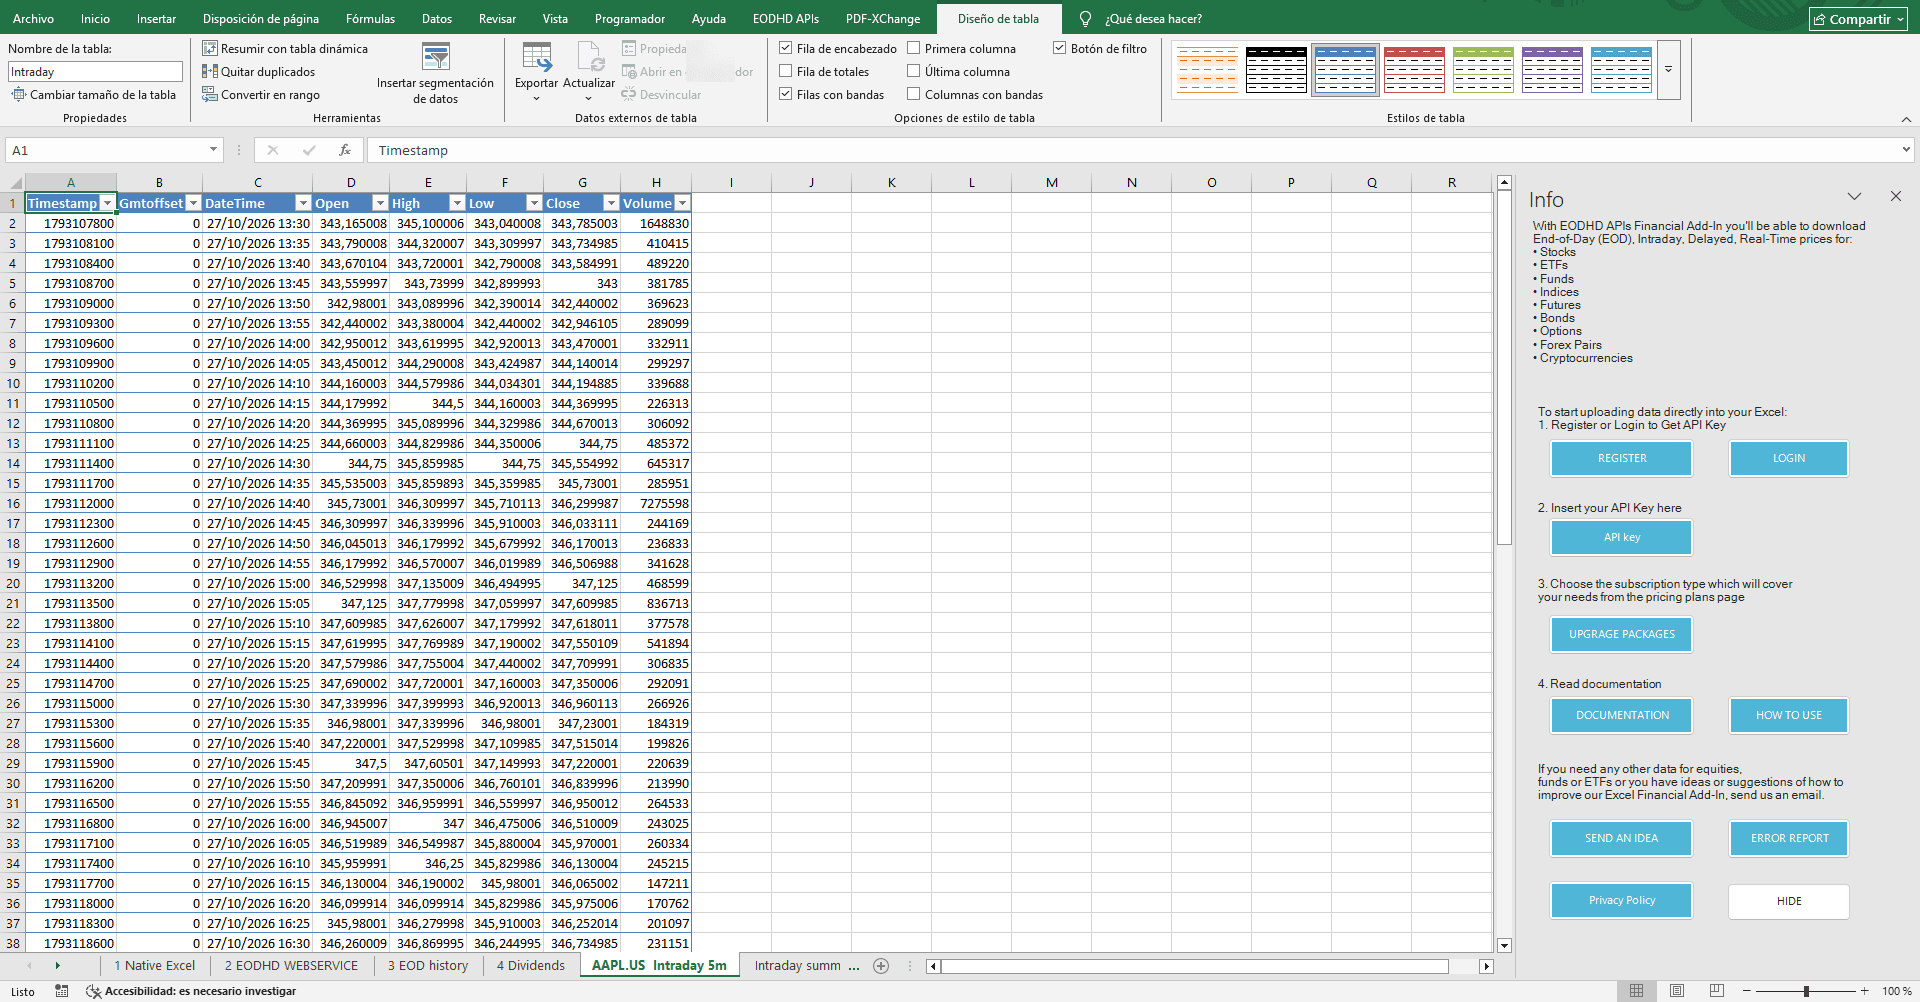
The DateTime column is in UTC (Gmtoffset 0), so the bars run from 13:30 to 20:00 UTC for that session. Intraday data requires the EOD + Intraday All-World Extended or All-In-One plan.
Live (delayed) stock prices in Excel with the Add-on
Live Stock Prices opens the Live Data Downloaders window. Each downloader has a name, a list of tickers and an update interval, and writes its prices to a sheet.
- Click Add. In the Live (Delayed) Stock Prices form, list the tickers, set Period (minutes) and click Create.
- Select the downloader in the list and click Start. In my test the status turned green and the add-on created a sheet named after the downloader.
- Finally, click Stop when you no longer need updates. The status turns red.
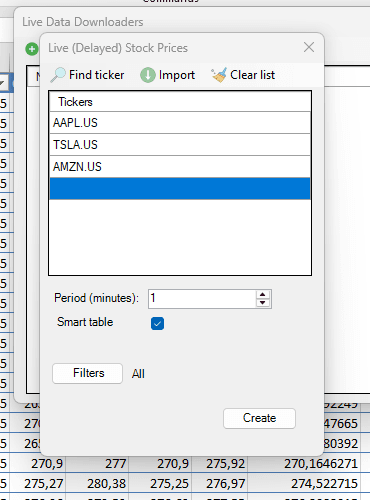
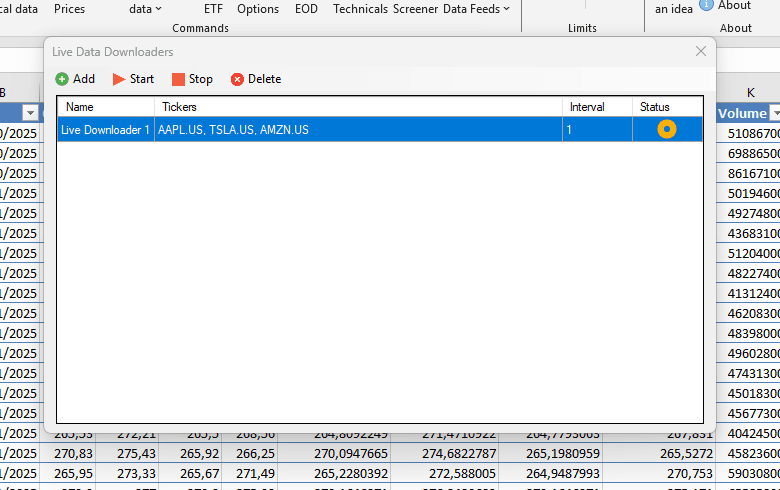
After that, the sheet shows Code, Timestamp, Gmtoffset, Open, High, Low, Close, Volume, PreviousClose, Change and Change_p for each ticker.
Fundamentals with the Add-on
Next, Get fundamental data has two parts. The button opens a form with a single Ticker field. Its drop-down arrow lets you load one section instead of the whole report: All Data, General, Highlights, Balance Sheet, Income Statement, FlowCash, Earnings or Bulk Fundamentals.
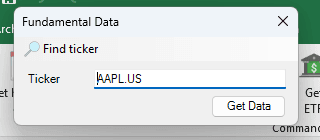
For AAPL.US, the full report filled a worksheet of 803 rows, grouped into General, Highlights, Balance Sheet, Income Statement, Cash Flow and Earnings. Each group expands with the outline buttons on the left. The balance sheet, income statement and cash flow sections each come in quarterly and yearly blocks.
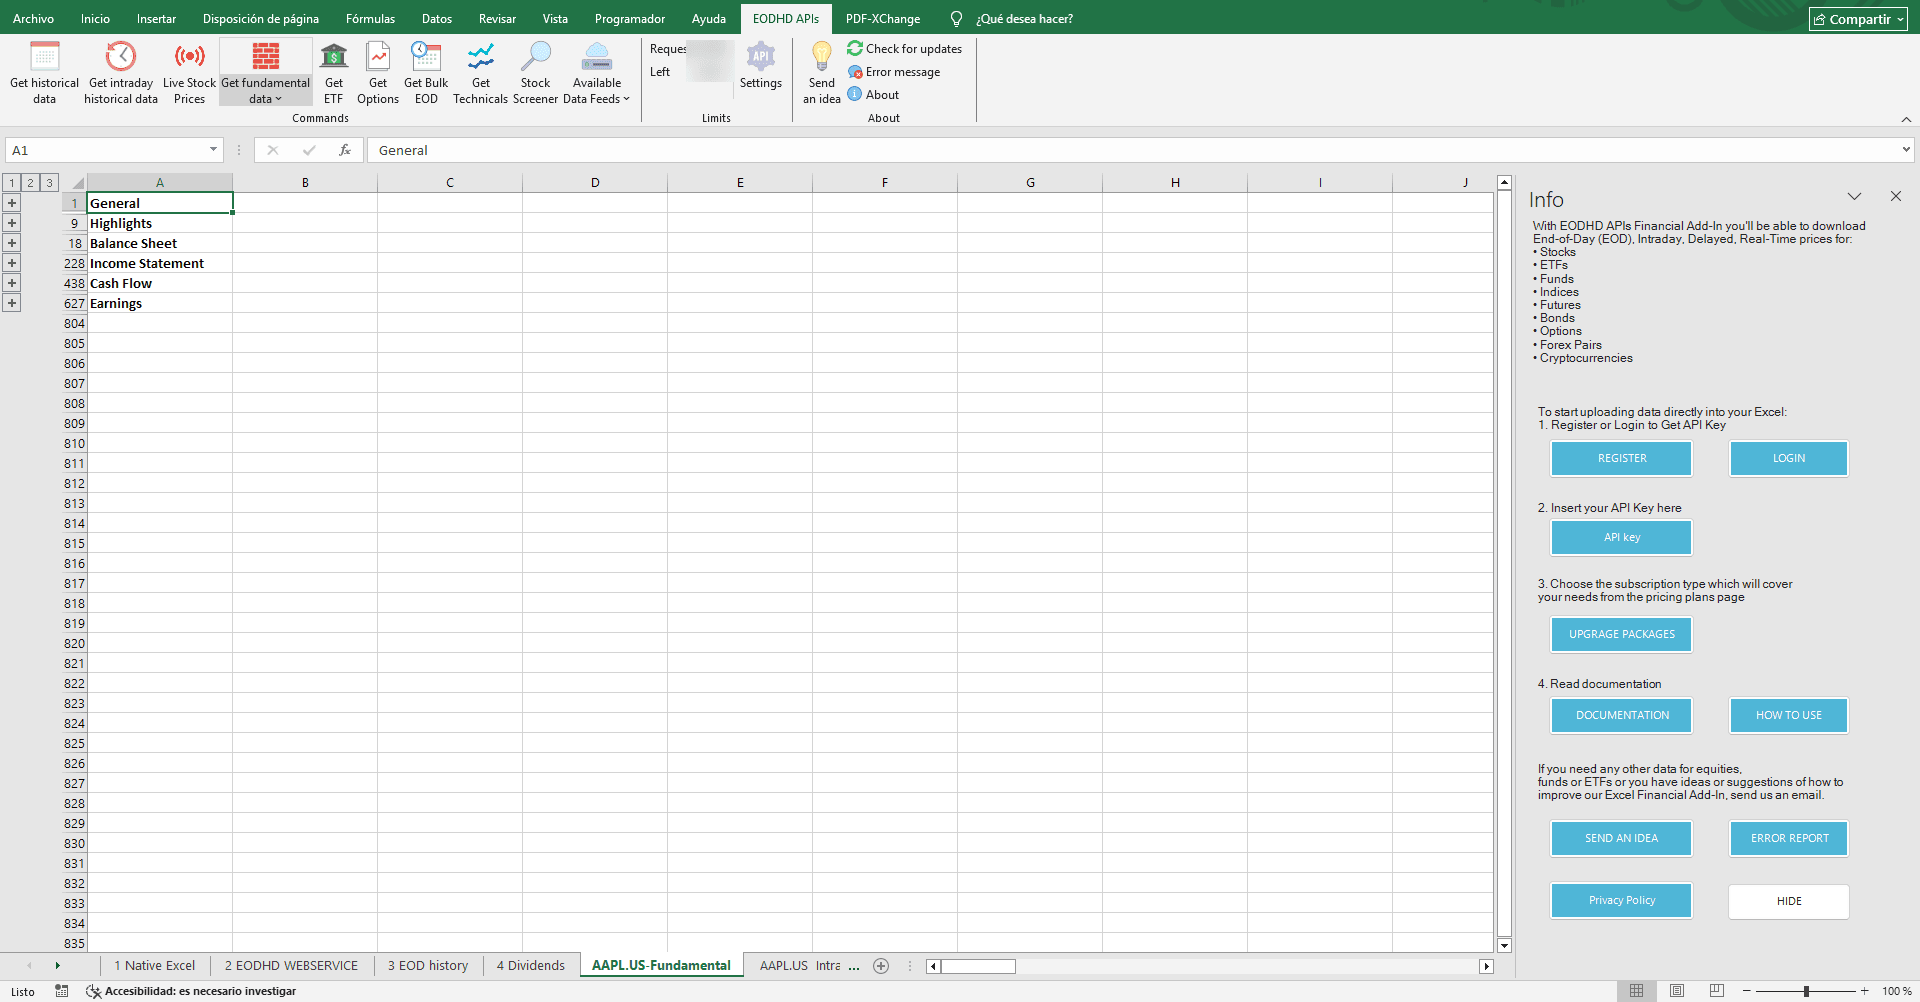
In particular, the Highlights block holds the headline numbers. For AAPL.US it showed a PE Ratio of 39.7951, a Dividend Share of 1.05 and a Dividend Yield of 0.003. The P/E and dividend yield match what the fundamentals API returned for the same fields.
Fundamentals require the Fundamentals Data Feed or All-In-One plan.
Technical indicators with the Add-on
Likewise, Get Technicals opens the Technical Indicators form. Pick a ticker, the date range, the Function and its Period, then click Get Data.
The Function list has 19 options: Average Volume, Average Volume by Price, Simple Moving Average, Exponential Moving Average, Weighted Moving Average, Volatility, Relative Strength Index, Standard Deviation, Slope (Linear Regression), Directional Movement Index, Average Directional Movement Index, Average True Range, Commodity Channel Index, Bollinger Bands, Split Adjusted Data, Stochastic Technical Indicator, Stochastic Relative Strength Index, Moving Average Convergence/Divergence and Parabolic SAR.
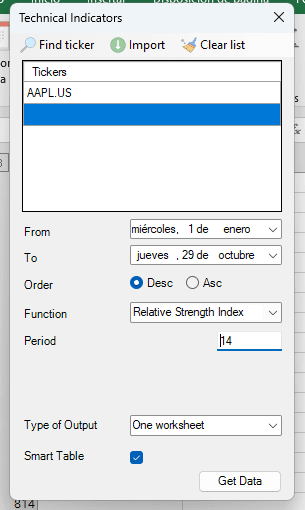
I requested a 14-period Relative Strength Index for AAPL.US from January 1, 2020. The add-on returned 1,700 daily values, from January 23, 2020 to October 27, 2026. The RSI for October 27, 2026 was 61.1072, the same value the technical indicators API returns for that day.
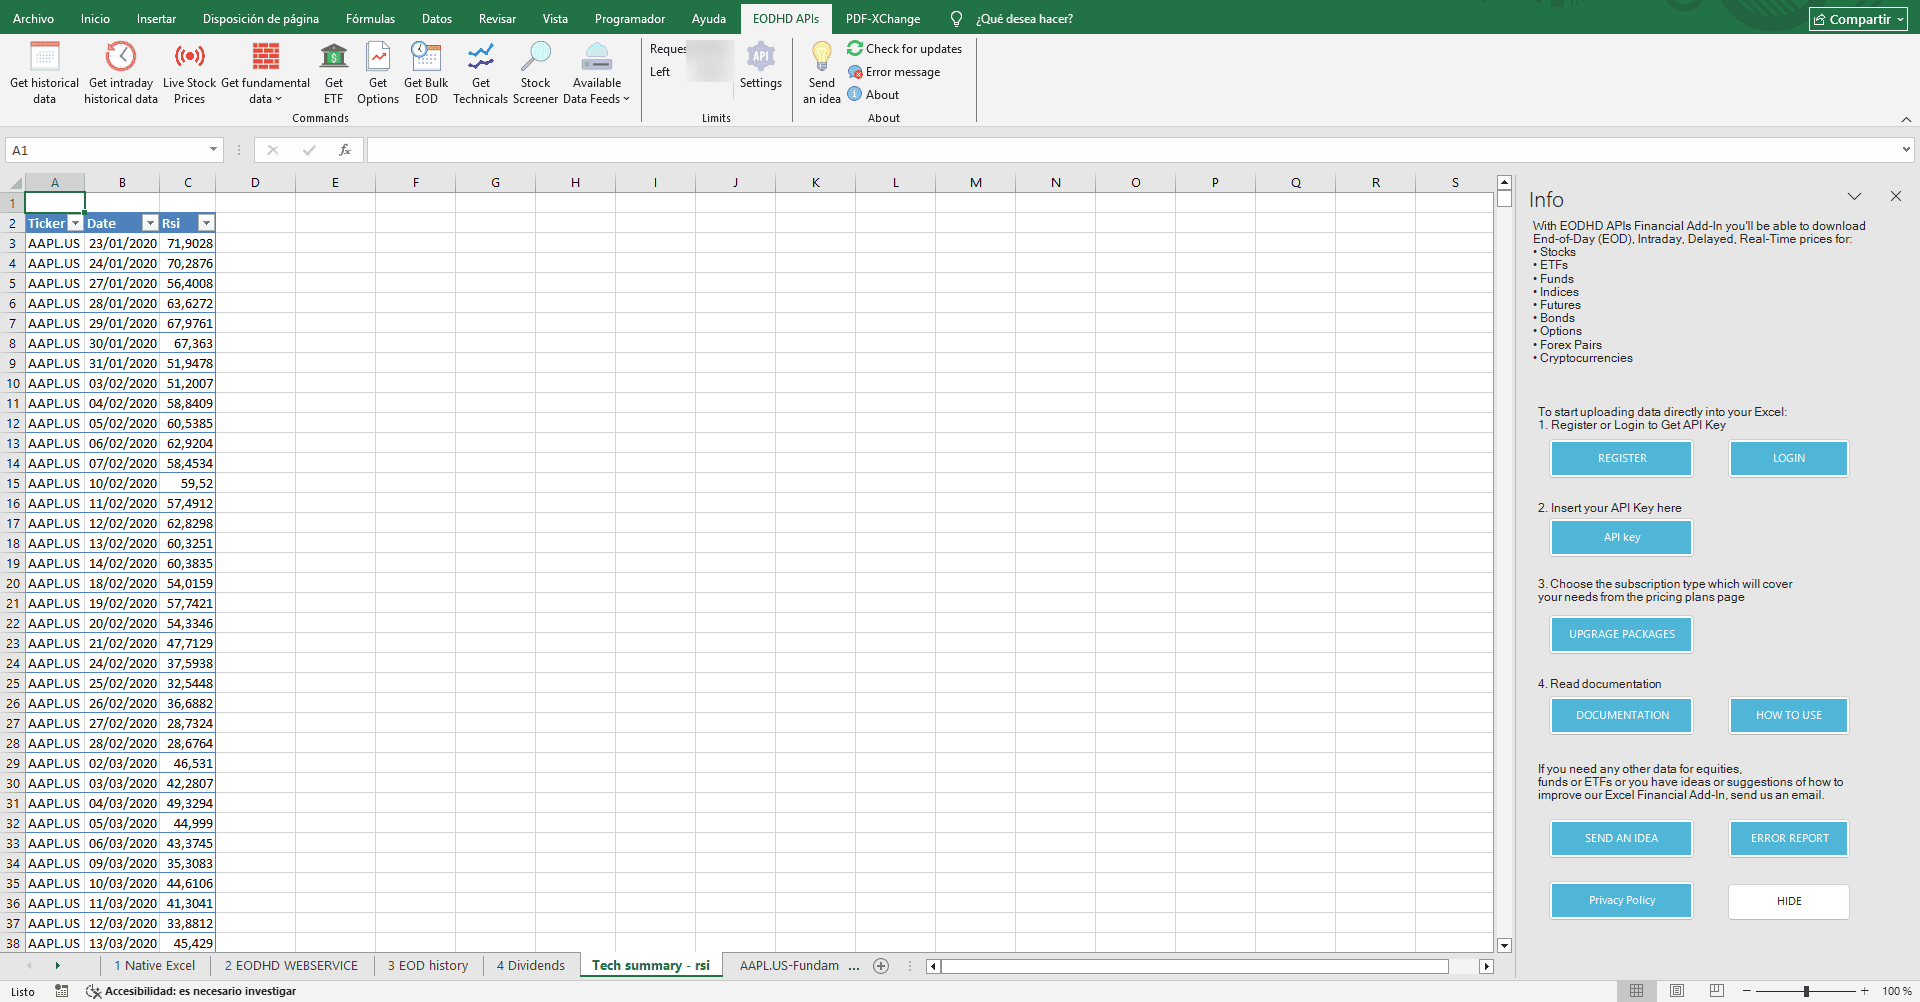
Similarly, technical indicators are included in the EOD + Intraday All-World Extended and All-In-One plans.
Dividends
In the add-on, the fundamentals report includes the current Dividend Share and Dividend Yield in Highlights. For the full payment history in a sheet, use the dividends endpoint with WEBSERVICE, shown in the next sections. EODHD’s bulk VBA workbook also includes a Get dividends button.
Live stock prices in an Excel cell with WEBSERVICE
For a value that has to sit in one cell, such as the last price next to each position in a portfolio sheet, use Excel’s WEBSERVICE function with the EODHD API.
The trick is the filter parameter. It makes the API return one bare value instead of a full JSON document, which is exactly what a cell needs:
=WEBSERVICE("https://eodhd.com/api/real-time/AAPL.US?api_token=demo&fmt=json&filter=close")WEBSERVICE returns text, so convert it to a number before you calculate with it. Use NUMBERVALUE with a period as the decimal separator, because the API returns numbers like 343.83:
=NUMBERVALUE(WEBSERVICE("https://eodhd.com/api/real-time/AAPL.US?api_token=demo&fmt=json&filter=close"), ".")The same pattern also works for fundamentals. Point it at the fundamentals endpoint and filter down to a single field, using the section and field names joined by two colons:
=NUMBERVALUE(WEBSERVICE("https://eodhd.com/api/fundamentals/AAPL.US?api_token=demo&filter=Highlights::PERatio"), ".")Example: four demo tickers in one Excel sheet
These are the values each request returned for the four demo-key tickers on October 29, 2026, before the US market opened, so the price is the October 28 close:
| Ticker | Last close | P/E | Market cap | Dividend yield | 52-week high | 52-week low |
|---|---|---|---|---|---|---|
| AAPL | 343.83 | 39.7951 | 5017916932096 | 0.003 | 351.73 | 242.7592 |
| TSLA | 404.22 | 444.1978 | 1597772529664 | NA | 498.83 | 297.38 |
| VTI | 379.17 | NA | NA | NA | 384.1509 | 308.7302 |
| AMZN | 254.6 | 20.4827 | 2746195378176 | NA | 287.2 | 196 |
This is the same sheet calculated in Excel 2016 on Windows, with NUMBERVALUE and the demo key:
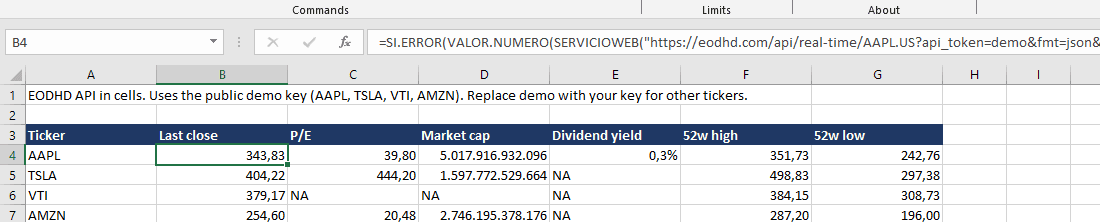
The fields behind each column:
| Column | Endpoint | filter |
|---|---|---|
| Last close | real-time | close |
| P/E | fundamentals | Highlights::PERatio |
| Market cap | fundamentals | Highlights::MarketCapitalization |
| Dividend yield | fundamentals | Highlights::DividendYield |
| 52-week high | fundamentals | Technicals::52WeekHigh |
| 52-week low | fundamentals | Technicals::52WeekLow |
Practical notes for WEBSERVICE formulas
A few practical notes before you fill a whole column with these formulas.
- NUMBERVALUE is safer than VALUE here. VALUE reads the text with your regional decimal separator, so in an Excel set up with a decimal comma, VALUE(“343.83”) returns #VALUE!. I hit exactly that in a Spanish installation, and NUMBERVALUE(text, “.”) fixed it.
- A field that doesn’t apply returns the text “NA”. VTI is an ETF, so the company fields are NA, and TSLA and AMZN return NA for dividend yield. Give IFERROR a fixed text fallback: =IFERROR(NUMBERVALUE(WEBSERVICE(url), “.”), “NA”). This is the formula behind every cell in the table above.
- Also, each cell is a separate API request. A fundamentals request counts as 10 API calls, and a real-time request counts as 1. A sheet with 20 tickers, a price column and five fundamentals columns makes 20 real-time and 100 fundamentals requests, or 1,020 API calls, each time those formulas are calculated. For more than a handful of tickers, the add-on is the better fit.
- WEBSERVICE works in Excel for Microsoft 365, 2024, 2021, 2019 and 2016 on Windows. According to Microsoft, it relies on Windows features and doesn’t return results on Mac.
- The demo key covers AAPL.US, TSLA.US, VTI.US, AMZN.US, BTC-USD and EUR-USD. For any other ticker, replace demo with your own API key. The free plan includes 20 API calls per day and one year of end-of-day prices, without fundamentals. Fundamentals fields need the Fundamentals Data Feed or All-In-One plan.
Historical stock prices and dividends in Excel with WEBSERVICE
The end-of-day and dividends endpoints can also return CSV. TEXTSPLIT, available in Excel for Microsoft 365 and Excel 2024, can split that text into rows and columns. My test machine runs Excel 2016, which doesn’t have TEXTSPLIT, so I ran these URLs directly and show the CSV they returned:
=TEXTSPLIT(WEBSERVICE("https://eodhd.com/api/eod/AAPL.US?api_token=demo&fmt=csv&from=2026-10-22&to=2026-10-28"), ",", CHAR(10))This is the CSV that URL returned:
Date,Open,High,Low,Close,Adjusted_close,Volume
2026-10-22,344.94,348.36,342.28,348.22,348.22,46898875
2026-10-23,349.115,351.73,345.75,347.725,347.725,39539690
2026-10-26,343.92,347.09,341.03,343.91,343.91,42743575
2026-10-27,343.165,347.78,342.39,347.1,347.1,39984395
2026-10-28,346.92,347.18,343.52,343.83,343.83,35714331
Close is the actual traded price, and Adjusted_close is adjusted for splits and dividends. Use Adjusted_close for returns over long periods.
Similarly, dividends work the same way with the div endpoint:
=TEXTSPLIT(WEBSERVICE("https://eodhd.com/api/div/AAPL.US?api_token=demo&fmt=csv&from=2026-01-01"), ",", CHAR(10))Date,Dividends
2026-02-09,0.26
2026-05-11,0.27
2026-08-10,0.27Keep the range short with this method, because WEBSERVICE returns #VALUE! when the response is longer than Excel’s 32,767-character cell limit. Each daily row above is about 55 characters, so that’s roughly 590 rows, a little over two years of trading days. For longer histories, use the add-on.
Bulk downloads with the EODHD VBA workbook
If you prefer to keep everything in a macro-enabled workbook, EODHD publishes two VBA examples on the Excel Add-on documentation page. According to that page:
The first adds a worksheet function, =EODSymbolData(Symbol, From_Date, To_Date), that you use like any other Excel function. The demo key in that file works with AAPL.US. To see or edit the code, press Alt+F11 and open the EODHistoricalData module.
The second is a bulk downloader. You change the demo key to your own and add the stocks you want to download. A Get dividends button downloads the dividends for every ticker in the list between the from and to dates, with a separate tab for each company.
Which method to use for stock prices in Excel
| WEBSERVICE + EODHD API | EODHD Excel Add-on | |
|---|---|---|
| Excel version | Windows: Microsoft 365, 2024, 2021, 2019, 2016 | Excel for Windows |
| Setup | One formula per cell | Installer + API key |
| Live or delayed prices | Yes, one value per cell | Yes, Live Data Downloaders |
| Daily history | Short ranges (32,767-character cell limit) | Yes |
| Intraday history | Not covered in this guide | Yes (1m to 1h) |
| Fundamentals | Single fields with filter | Full report by section |
| Dividend history | Yes (CSV, Microsoft 365 or 2024 to split it) | Current yield and dividend per share |
| Technical indicators | Not covered in this guide | Yes (19 functions) |
| Best for | A live column in a portfolio sheet | Research workbooks and bulk data |
In practice, the methods combine well. A common setup is a portfolio sheet with a WEBSERVICE column for the latest price, and a research tab filled by the add-on with years of adjusted history and the company fundamentals.
Conclusion
Getting stock prices in Excel no longer requires copying numbers from a website. A single WEBSERVICE formula keeps a live value in any cell, and the EODHD Excel Add-on fills a sheet with history, intraday bars, fundamentals and indicators in a few clicks.
First, use the demo key on AAPL, TSLA, VTI or AMZN to see the data in your own workbook, then move to your own key when you need other tickers.
FAQs
Q: How do I get live stock prices in Excel?
In any Windows version from Excel 2016, use =NUMBERVALUE(WEBSERVICE(url), “.”) with the EODHD real-time endpoint and filter=close. That puts a single price in the cell. With the EODHD Add-on, Live Stock Prices keeps a list of tickers updated on a sheet.
Q: How do I get historical stock prices in Excel?
Use Get historical data in the EODHD Excel Add-on: enter the ticker, the period and the dates, and it writes a table with raw and adjusted prices. For short ranges you can also call the EODHD end-of-day endpoint with WEBSERVICE.
Q: Can I get stock fundamentals like the P/E ratio in Excel?
Yes. For a specific field from a company’s fundamentals, use WEBSERVICE with the EODHD fundamentals endpoint and a filter such as Highlights::PERatio, or load the full fundamentals with the EODHD Excel Add-on.
Q: Does WEBSERVICE work on Mac?
No. Microsoft notes that WEBSERVICE relies on Windows operating system features and does not return results on Mac. On a Mac, use the EODHD Google Sheets add-on.