

Quick jump:
High-frequency trading (HFT) is a cornerstone in finance. It uses powerful computers for fast transactions. A large number of orders are executed at high speeds. These platforms can execute market orders in a fraction of a second. They leverage algorithms to analyze multiple markets at once. The importance of HFT is in its ability to provide liquidity. It reduces transaction costs and brings market efficiency. However, it also brings complexity and potential risks.
HFT algorithms can analyze long-term price trends and incorporate this information into their trading strategies. This can significantly improve prediction performance. Furthermore, HFTs are able to predict both permanent and transitory price changes, suggesting a positive role in incorporating information into prices.
This article delves into High-Frequency Trading Analysis using Python. Python programming is known for its simplicity and robustness.
Python and AI in Finance
Python’s versatility makes it ideal for financial data analysis. It has libraries like Pandas and NumPy, which simplify data manipulation. These libraries are essential for handling large datasets common in finance.
We’ll explore Python’s use in analyzing stock market data, making stock market predictions, and delving into cryptocurrency trading. We’ll also touch on the role of AI and Machine Learning in finance, particularly in the context of High-Frequency Trading (HFT).
As a senior data scientist, I’ve had extensive experience using Python and its libraries in the finance industry. One of the key practices in financial data analysis is using reliable data sources. APIs, like those from EOD Historical Data, are invaluable in this regard. They provide access to a wealth of stock data that we can pull for our analysis.
Why EODHD is a better fit for HFT?
EODHD provides robust, powerful, and reliable data. Their APIs offer comprehensive and reliable historical stock data. This data is crucial for HFT, as it provides the raw material for making accurate predictions.
With EODHD APIs, you can implement HFT on any ticker from its extensive database. The APIs provide end-of-day data, which includes high, low, open, and close prices, along with the volume of trades. This data can be used to feed your HFT algorithms, enabling them to make accurate predictions.
The data from EODHD APIs is ideal for HFT for several reasons. First, it’s comprehensive. It covers a wide range of tickers across multiple markets. This gives your HFT algorithms a lot of data to work with, increasing the chances of making accurate predictions.
Second, EODHD data is reliable. The data is sourced from official exchanges and is thoroughly cleaned and validated. This ensures that your HFT algorithms are working with high-quality data, reducing the risk of errors.
Finally, EODHD offers fast and flexible services. This means you can quickly and easily access the data you need when you need it. In the fast-paced world of HFT, speed is everything. The faster you can access and process data, the more successful your trading strategy will be.
Analyzing Stock Market Data
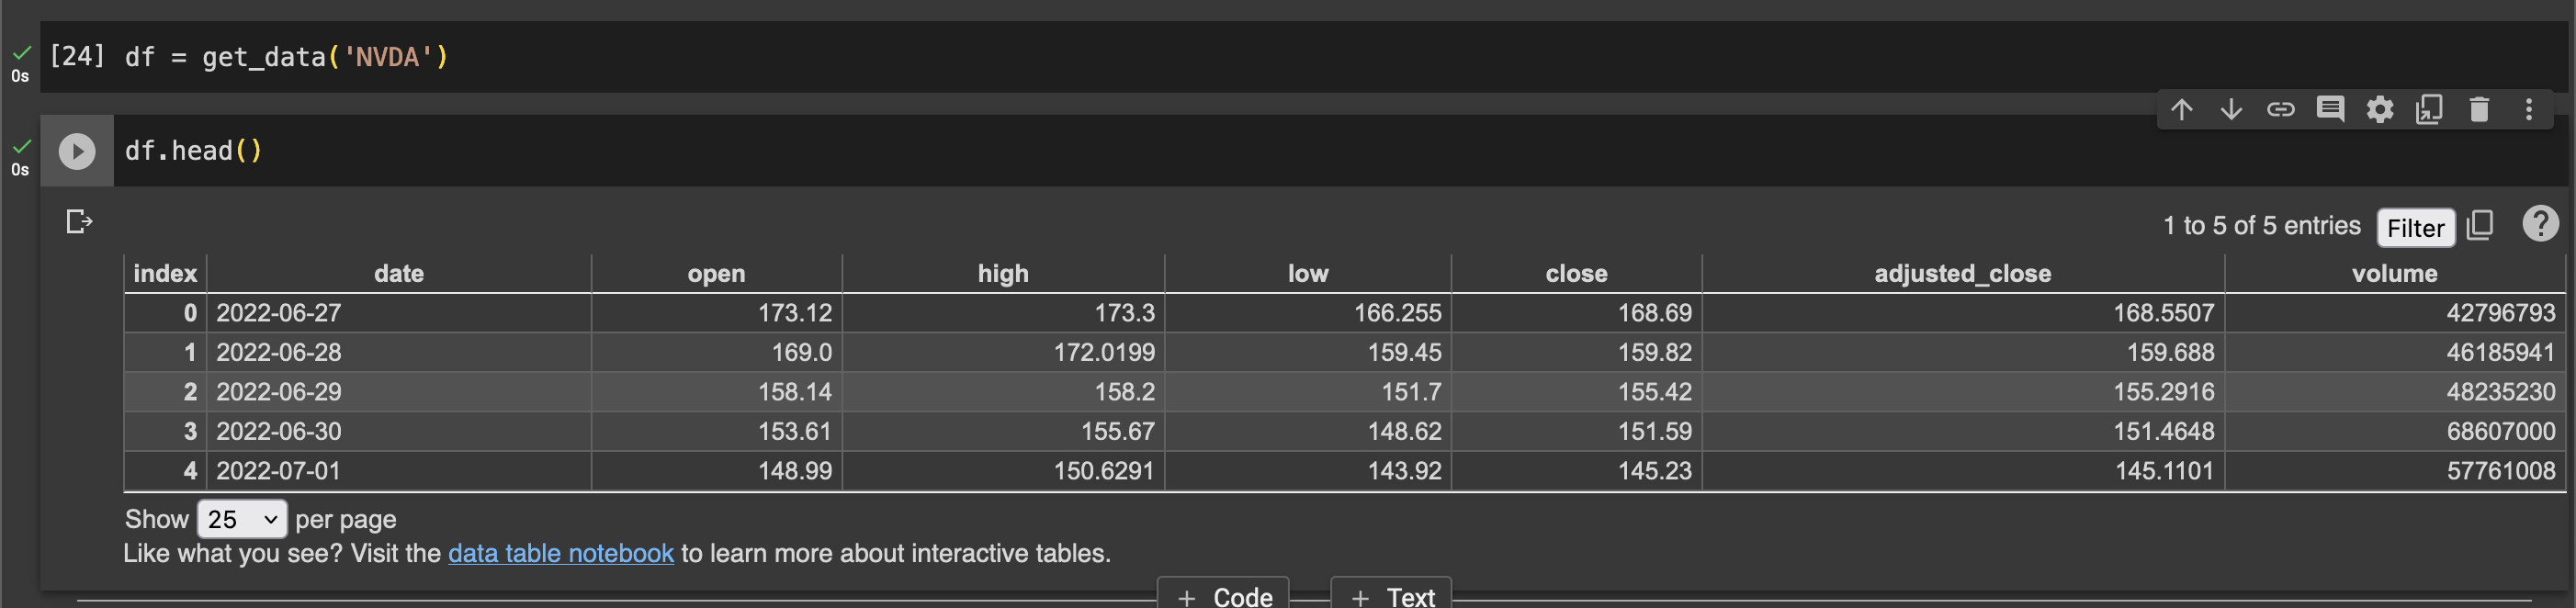
Let’s consider a scenario where we analyze stock market data. We use the EOD Historical Data API to pull this data. Here’s a simple Python code snippet to do this:
import requests
import pandas as pd

def get_data(symbol):
    api_token = 'YOUR_API_TOKEN'
    url = f'https://eodhistoricaldata.com/api/eod/{symbol}?api_token={api_token}&fmt=json&period=d'
    data = requests.get(url).json()
    df = pd.DataFrame(data)
    return df
In this code, we first import the necessary libraries. The requests library is used to send HTTP requests, and pandas is used for data manipulation and analysis. We then define a function get_data that takes a stock symbol as an argument. Inside this function, we specify our API token and construct the URL for the API request. We send a GET request to the EOD Historical Data API and receive the data as a JSON object. Finally, we convert this JSON object into a pandas DataFrame for easier analysis.
Python’s power extends to cryptocurrency trading as well. Libraries like ccxt provide a unified way to interact with over 100 cryptocurrency exchanges. This allows for real-time data analysis and trading.
AI and Machine Learning have a significant role in finance. They help in predicting market trends and making informed decisions. Python libraries like scikit-learn and TensorFlow are instrumental in this.
Stock Closing Price Prediction
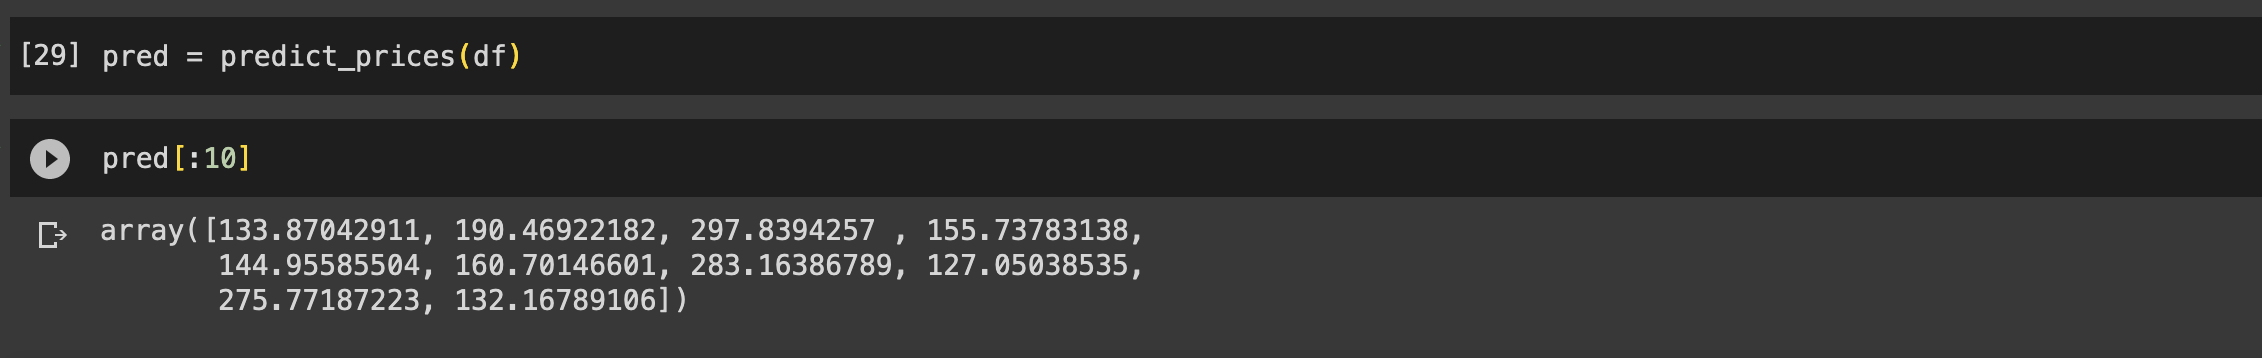
Consider a scenario where we use machine learning for stock prediction. We can use historical data to train a model. This model can then predict future stock prices. Here’s a simplified example:
from sklearn.model_selection import train_test_split
from sklearn.linear_model import LinearRegression

def predict_prices(df):
    X = df[['high', 'low', 'open', 'volume']].values
    y = df['close'].values
    X_train, X_test, y_train, y_test = train_test_split(X, y, test_size=0.2)
    model = LinearRegression()
    model.fit(X_train, y_train)
    predictions = model.predict(X_test)
    return predictions
In this code, we first import the necessary libraries. The train_test_split function is used to split our data into training and testing sets, and sklearn.linear_model.LinearRegression is used to create a Linear Regression model. We then define a function predict_prices that takes a DataFrame as input. Inside this function, we prepare our feature matrix X and target vector y. We split the data into training and testing sets, train the Linear Regression model on the training data, and make predictions on the testing data.
Conclusion
High-frequency trading is a complex field. It requires a deep understanding of financial markets and data analysis. Python, with its powerful libraries, simplifies this task. It allows us to analyze large datasets and make predictions.
In this article, we explored how to use Python for financial data analysis. We saw how to pull data using the EOD Historical Data API. We also looked at how to use machine learning for stock prediction.
Remember, the financial market is unpredictable. Even the most sophisticated models can’t guarantee success. It’s important to use these tools as part of a larger strategy.
My Advice
As a senior data scientist, I’ve learned a few things. First, always question your data. It’s important to understand where it comes from and how it’s collected. This can impact your analysis.
Second, keep learning. The field of data science is always evolving. New tools and techniques are constantly being developed. Stay up-to-date with the latest trends.
Third, don’t rely solely on models. They are tools to aid decision-making, not make decisions for you. Always use your judgment.
Finally, remember the importance of communication. Being able to explain your findings is as important as the analysis itself.