Power BI for financial and trading data analysis using financial trading data from EOD Historical Data (EODHD APIs) data API
If you want to learn how to install the EODHD Power Bi Connector for Financial Data APIs and activate your API key, we recommend to start with exploring of our Documentation for it.
Welcome back to the next instalment of my Financial APIs Academy series for EODHD APIs. The article can also be found here.
I’ve noticed Microsoft Power BI is becoming increasingly popular. At least many of the clients I work with now are using it. I wanted to investigate what it is, how it’s used, and if it could be used for trading data analysis (which is an interest of mine). The Power BI Desktop version is surprisingly free!
The first “stumbling block” I faced is I’m a Mac user, and there isn’t a version for OSX currently. The forums are packed with requests for it, so hopefully Microsoft will release it at some point. There are however work arounds.
I got it working using Oracle VM Virtualbox (free) and a development virtual machine of Microsoft Windows 11 (also free). It works but it is seriously resource hungry. I assigned 4 CPU’s and 16384 MB memory and it still did not feel desktop-worthy. I’m not complaining, at least it works. I wrote on article covering how I set it up.
https://trading-data-analysis.pro/power-bi-for-mac-88228621852e
I managed to use a Windows desktop to capture some of the screenshots for this article, as the laggy feel to working within the virtual machine was working my last nerve 😉
Power BI for Trading and Stocks Price Predictions
I have a keen interest in trading data analysis using a variety of methods. I’m always on the lookout to evaluate new tools, concepts, and strategies. I was not sure if Power BI would be useful or not for this but I thought I would try it out and share my evaluation.
The first step is we need some trading data to work with. I have a subscription with EODHD APIs, and this is my main source of financial data. There are free tier options as well which are useful when writing articles like this. I found two ways to retrieve data from them directly into Power BI. Both are easy enough but have their own pro’s and con’s. You can decide which method you prefer.
Option 1: EODHD APIs Power BI Add-on
I found a Power BI add-on on their website. It works well once it’s installed but takes some time to set-up. I like that they have simplified the data retrieval and not having to work with REST API calls. The downside is that it requires you to download the add-on from Google Drive and that you need to turn off add-on security in Power BI in order to use it. It’s a pity that Power BI does not allow you to selectively trust add-ons rather than having to blankety turn them all of completely. I will however show you how it works.
You will need to download the Microsoft Power BI Desktop add-on from Google Drive, unzip the archive, and put it in your user Documents directory on your desktop/VM.
Directory Structure:
Documents > Microsoft Power BI Desktop > Custom connectors > EOD Power BI Connector.mez
Once you have done that open Power BI and go to “Options and settings”.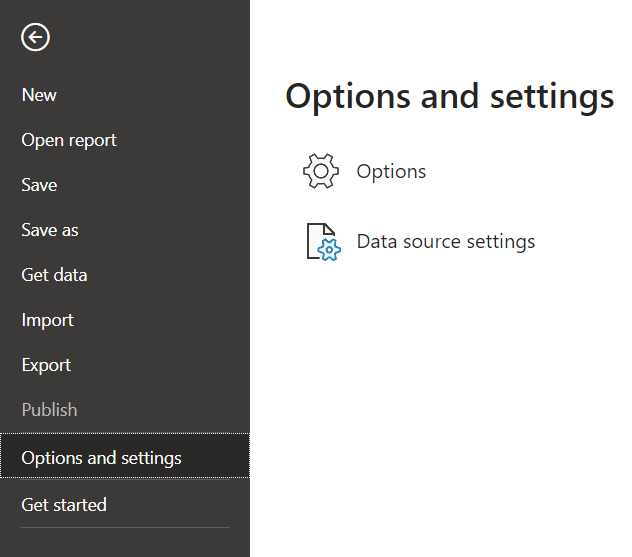
This is the part I’m not so thrilled about — under the “Security” global settings, scroll down to “Data Extensions”. Make sure the radio button is on “(Not Recommended) Allow any extension to load without validation or warning”.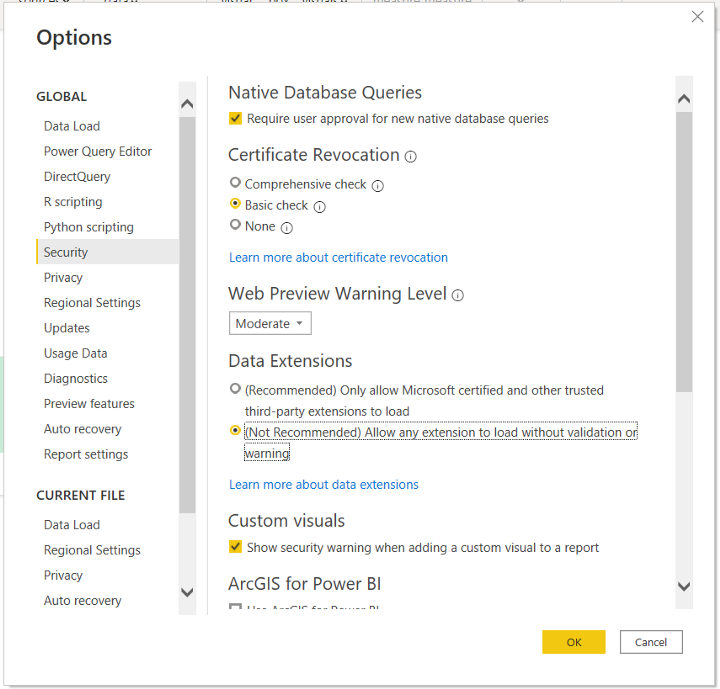
Once you have done that click “OK”. You may be asked to restart Power BI which you will want to do.
Click on the “Get data” menu option in Power BI. You will get a variety of useful options, but for this case we will select “More…”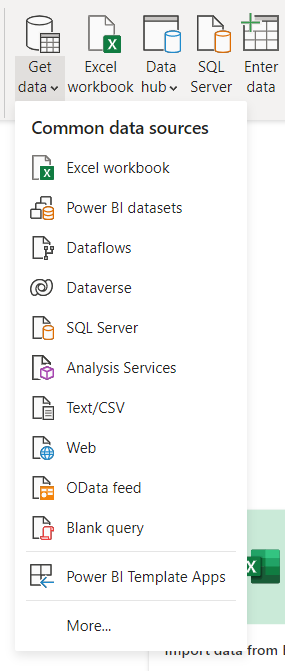
If all has gone to plan and the custom connector is in the correct place, and the security has been relaxed, if you search for “eod” you should see the three options below. For this tutorial, please select “EOD End of day data (Beta)”.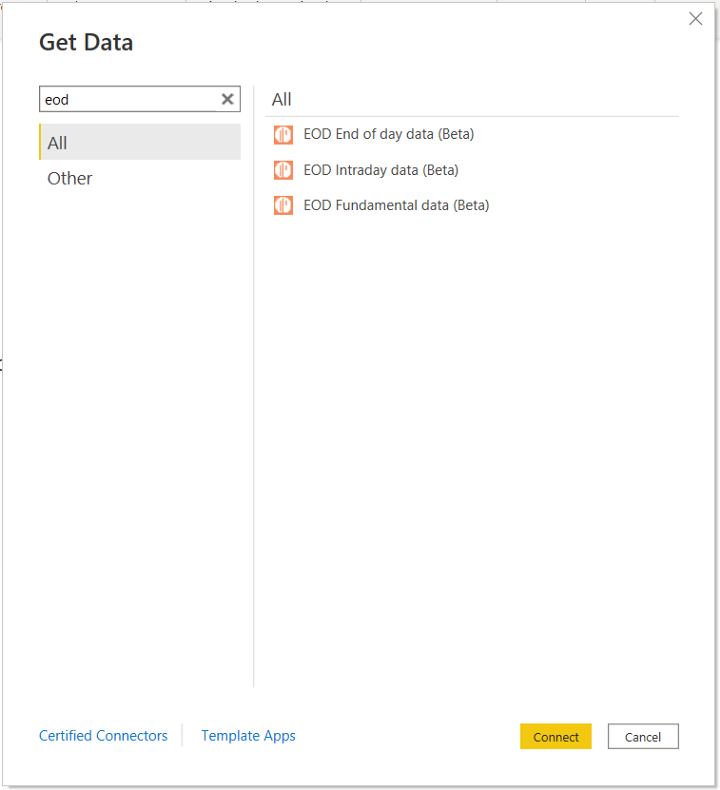
It will ask if you want to connect using a third-party service, and in this case we do. Check the “Don’t warn me again for this connector”, and click “Continue”.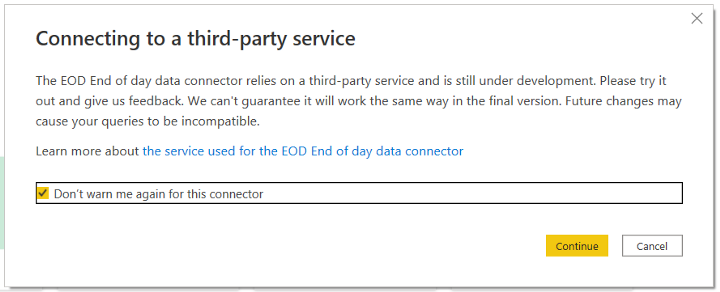
Retrieving data via the add-on is so easy. You just specify the ticker with exchange, period, and the from and to (which are optional). I’m using the MCD.US ticker for this article because you can access it for free using the “demo” API key. If you have an account with EODHD APIs, you can access all their data.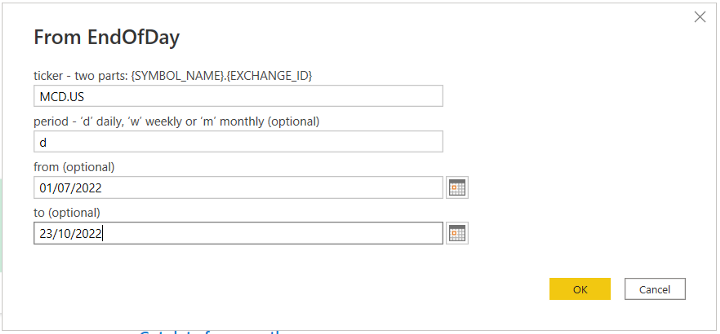
It will ask you for your API key. If you access any of the free tier markets, you can use the “demo” API key as below.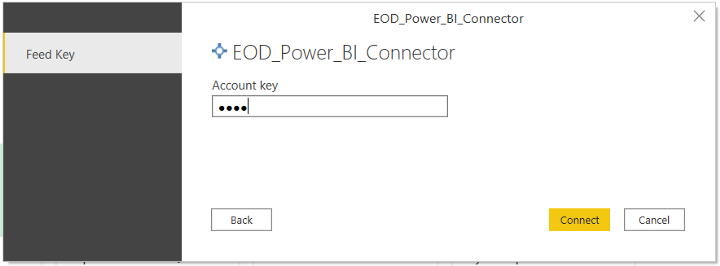
When you click “Connect” you will see a preview of the data. This will give you the opportunity to “Load” the data as is (which we want to do), or “Transform Data” if you want to make any adjustments on the import.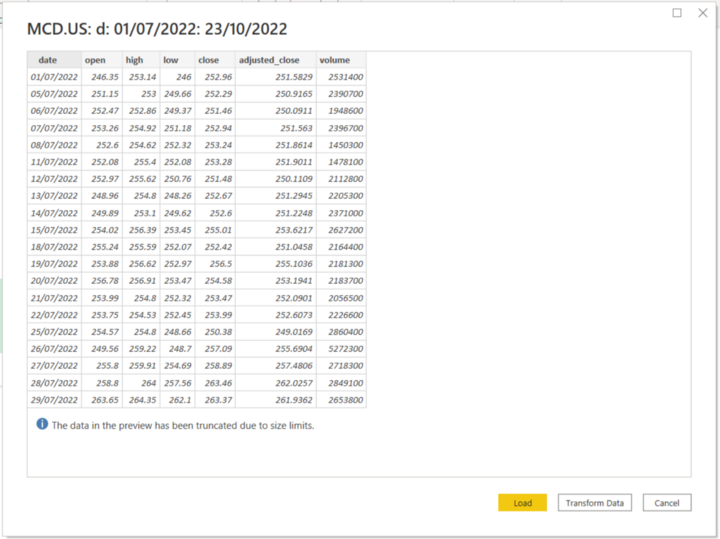
When the data is imported into a table it will look as below. The table will be called “Query1” or similar. My advice from trial and error is not to leave it like this. You will want to give your data a re-usable name like “MarketData”. I’ll explain why further down but this is definitely something you want to do. The way you rename the table is to right-click on “Query1” and you will receive a menu, then select “Rename”.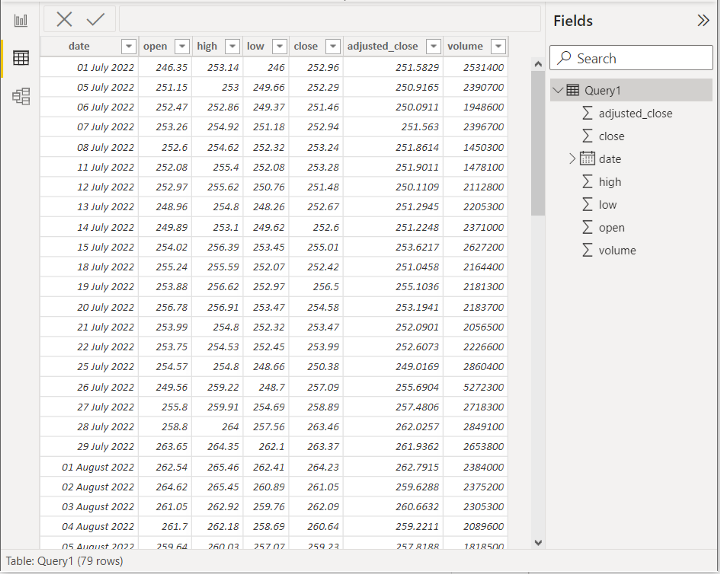
If all goes to plan, it should look like this…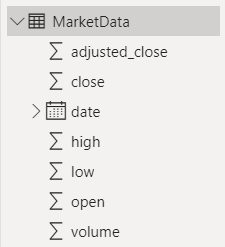
Option 2: Retrieve the data directly from the API
Now this is my personal favourite, and not all that complicated to do. You can try this out by opening the following link in your browser, “https://eodhistoricaldata.com/api/eod/MCD.US?api_token=demo&from=2020-07-01&to=2020-10-23&fmt=json”
I’ve highlighted the parts of interest. “MCD.US” is the ticker for McDonald’s Corp. It’s one of the free tickers you can access using the “demo” API key. If you want to use one of the subscription only tickers you can use your API key instead of “demo”. The “&from=2020–07–01&to=2020–10–23”, I’ve included in italics is optional and allows you to specify a range. The “&fmt=json” is important as it instructs the API to return a JSON response which Power BI will understand.
In order to retrieve the data into Power BI, we’ll use the “Get data” menu item. This time instead of selecting “More…”, we will select “Web”.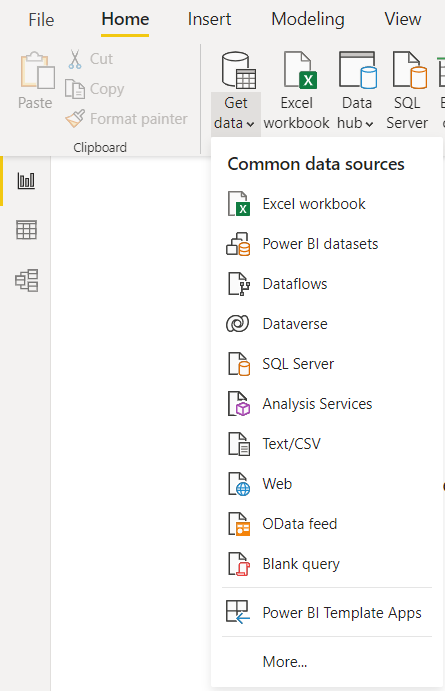
Select the “Basic” option and include your API call (mentioned above) as follows…
This will return the data into the Power BI query editor. It’s mostly ready to go but I would just rename the query on the left to “MarketData” as we did before. Click the “Close & Apply” menu button on the top left and that will populate the Power BI table.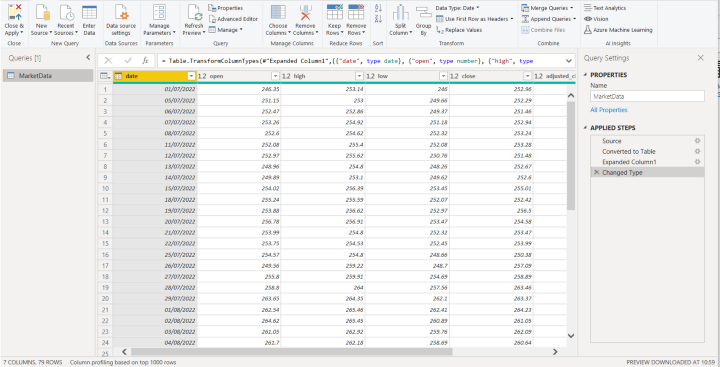
Both “Option 1” using the add-on and “Option 2” using the direct API call will leave us in the same place now. So take your pick which ever you prefer to get you to this point.
Forecasting Stocks Prices in Power BI
I wanted to introduce you to some “out-the-box” functionality with Power BI. It will also help you understand the basic components of Power BI and where to find everything.
On the left of the image below the “Clipboard”, you will find 3 icons. The top icon helps you to design your user interface, the middle icon contains your tables and data, and the bottom icon contains your model. We will want to select the top icon to design our user interface.
On the right you will see three side panels for “Filters”, “Visualisations”, and “Fields”. We will be using “Visualisations” first. Under “Visualisations”, there are some great visualisations to help you build your interface. For the forecasting, we will want to add a “Line Graph”. The icon for this is on the second row on the left.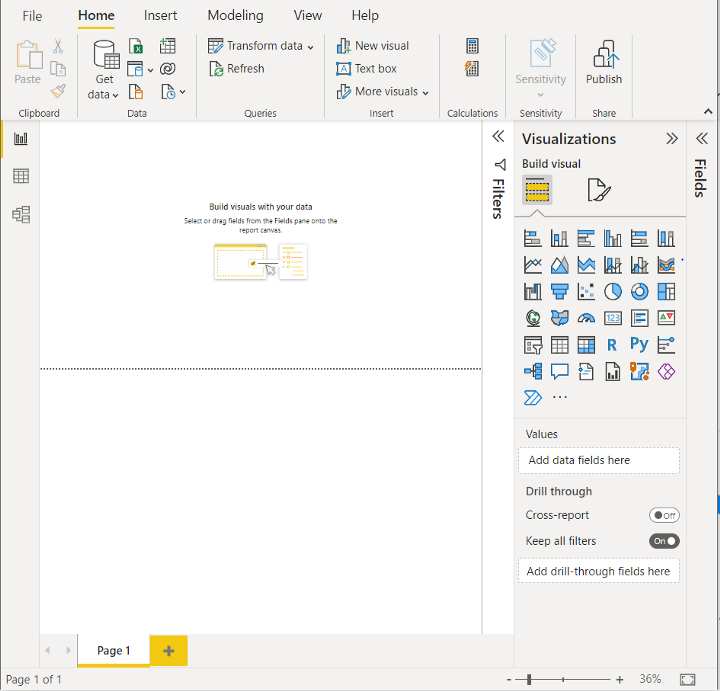
When we select it, it will add it to our viewing pane. You will see it asks for two inputs, the “X-axis” and “Y-axis”. Expand the “Fields” side panel and drag the “date” field from our table onto the X-axis, and “adjusted_close” onto the Y-axis. It should look like the line graph below (or similar depending on what data has been used).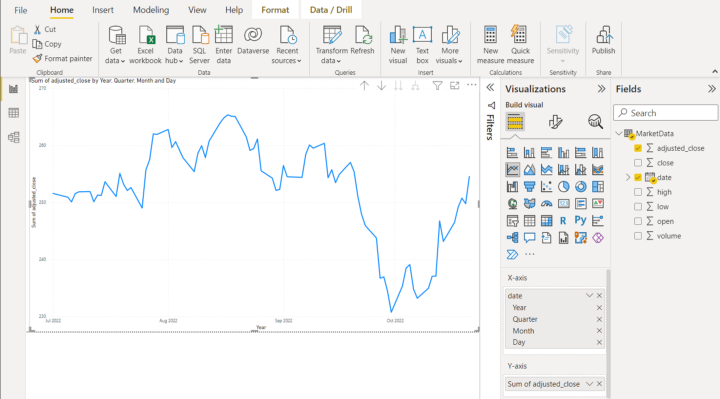
We now want to elevate the functionality of our line graph. If you look at the “Visualisations” panel title, under it you will see three icons. We want to click on the one that looks like a magnifying glass. This will provide us with a load more options. The one we are interested in, is the “Forecast”. You can fine tune the options later, but you can “Apply” the defaults for now. Make sure you toggle “Forecast” to on 🙂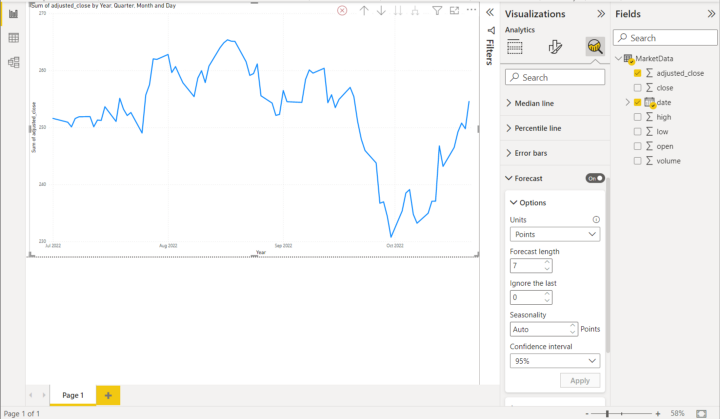
Now this is the first “gotcha” I noticed… nothing happens! After some investigation I noticed there was a red cross above my graph. I hovered my mouse over it and I got this error message.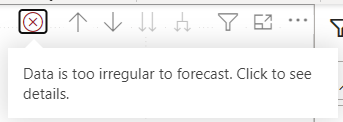
I don’t think Power BI likes an inconsistent trend for forecasting. So how can we fix this? If we look from the beginning of October 2022, there is an upward trend. What we can do is open the “Filters” side panel and drag our “date” field from “Fields” onto the “Add data fields here” box under “Filters”.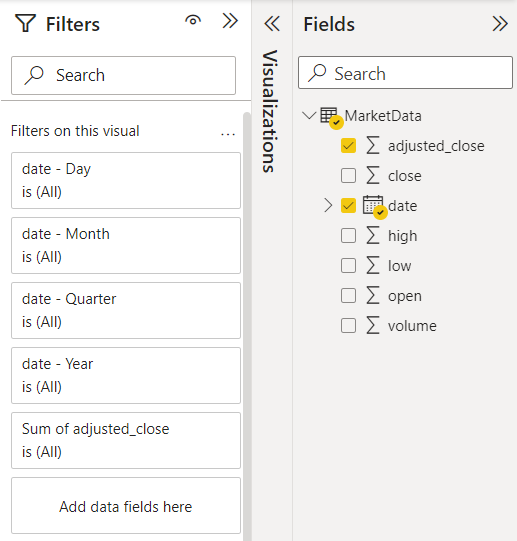
What we want to do is change the “Filter type” to “Advanced filtering”. Then set the “Show items when the value”, “is after”, “01/10/2022”, and click “Apply filter”. Not entirely sure how Power BI is performing that forecast, but at least it is working. Maybe it will look better using traditional financial data. I am not convinced this is that helpful for trading data.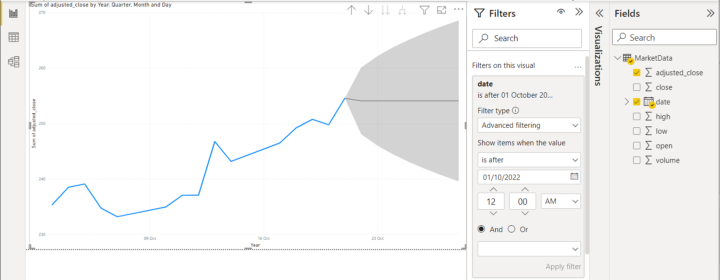
Linear Regression in Power BI to Predict the Stocks Prices
I wanted to see if there was some other useful “out-the-box” functionality in Power BI to help with trading data analysis… I didn’t find anything! I don’t think Power BI was designed for that purpose.
I did however find some exciting functionality in Power BI called DAX. Data Analysis Expressions (DAX) is a programming language that is used throughout Microsoft Power BI for creating calculated columns, measures, and custom tables.
I wanted to see if DAX could be used to perform “a basic” linear regression calculation. In order to complete the “y = mx + c” equation, we will need to perform a few calculations.
Before we get into that there is something important we need to do. Linear regression won’t like the “date” column on the X-axis. It needs to be numeric. What we will do is add an index field that will start from 0 to plot the X-axis. Power BI has some built in functionality to do this, but it took me some time to find.
Click on the third icon at the bottom on the left. Select the “Transform data” menu item drop-down, and select “Transform data”.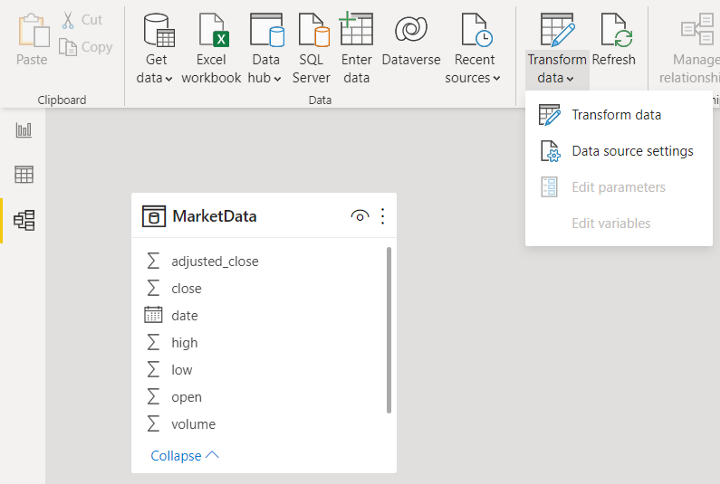
Select the “Add Column” menu item at the top, then “Index Column”, then select “From 0”. This will automatically generate a new column called “index” that will start from 0. This will form our X-axis.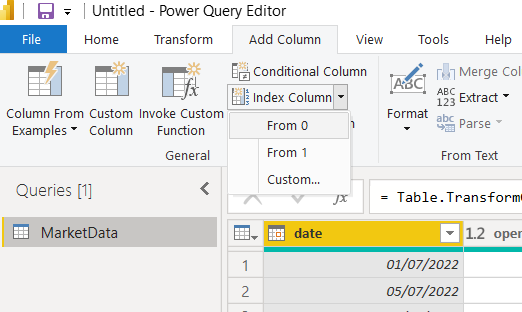
What will the “index” represent in our data? Well it could be “days from 01/10/2022”. 0 would be 01/10/2022, 1 would be 02/10/2022, and so on. When we are done we want to close and apply our transform and return back to the Power BI interface.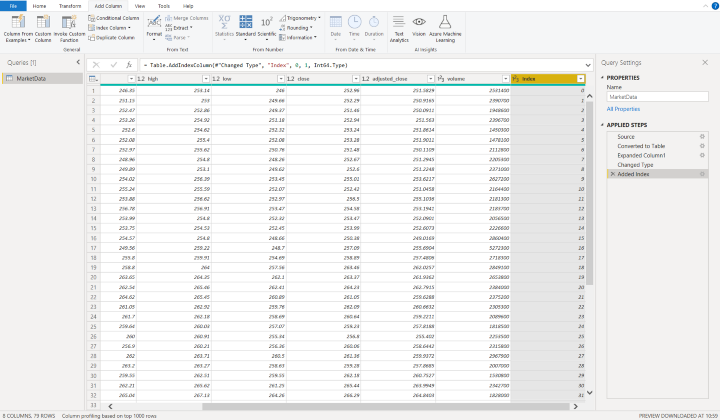
Now that we’ve done that we can go back to the middle icon on the left to view our data table.
We can start preparing our calculation. If we right-click on our “MarketData” table, we will receive some menu options. We will want to create two additional columns using the “Create column” option.
The two additional calculated columns will have these formulas:
xsq = MarketData[index]^2

xy = MarketData[index]*MarketData[close]
You may have realised why I asked you to rename your table to “MarketData”. It means you can use these two formulas as is to create your two new calculated columns without making any changes. This will mean the formulas are generic and can be applied to any trading data. Obviously if you did not use the same table name or have multiple tables you may want to adjust this. If you have done this correctly, your original table should have the additional “index”, “xy”, and “xsq” fields as below.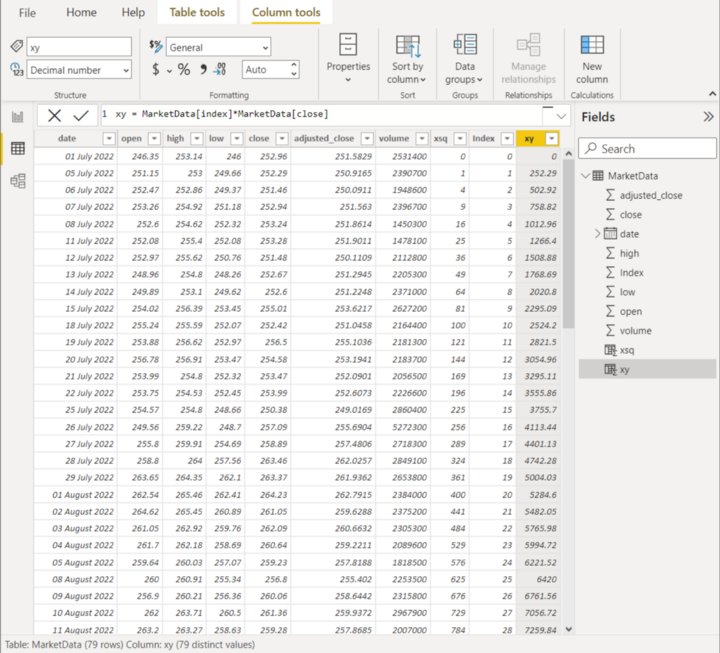
Once we have added our additional calculated columns, we now need to add several measures. It’s the same process as creating a column. You right-click on the “MarketData” table and then select “Create measure”. You will use the formulas I have prepared for you and it will just work. One formula per measure.
n = COUNTROWS(MarketData)

xsum = SUM(MarketData[index])

ysum = SUM(MarketData[close])

xysum = SUM(MarketData[xy])

xsqrsum = SUM(MarketData[xsq])

m (Slope) =
DIVIDE(
    [n]*[xysum]-[xsum]*[ysum],
    [n]*[xsqrsum]-[xsum]^2,
    0
)

b (Intercept) =
DIVIDE(
    [ysum]*[xsqrsum]-[xsum]*[xysum],
    [n]*[xsqrsum]-[xsum]^2,
    0
)
Once again, because our table is called “MarketData” these formulas will work as is without any changes.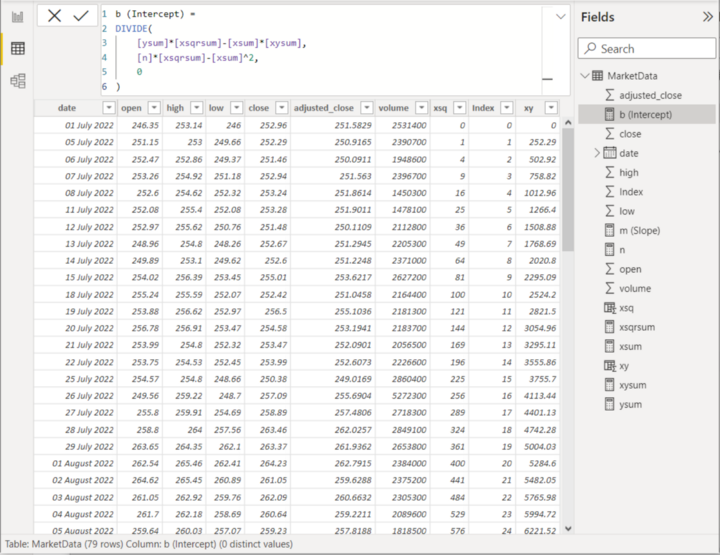
What we want to do now is create our user interface. Click on the top icon under “Clipboard” on the left to go back to the user interface design. Previously we used a line graph which was the on the second row on the left. We now want to use a scattergraph which is on the third row, third from the left.
Expand the “Fields” side panel and drag the “index” field we created to the X-axis, and drag the “adjusted_close” to the Y-axis. The “adjusted_close” will be automatically summarised and we don’t want this. Use the drop-down arrow for the Y-axis and select “Don’t summarise” as below. You may also want to increase the size of the visualisation to use the full space.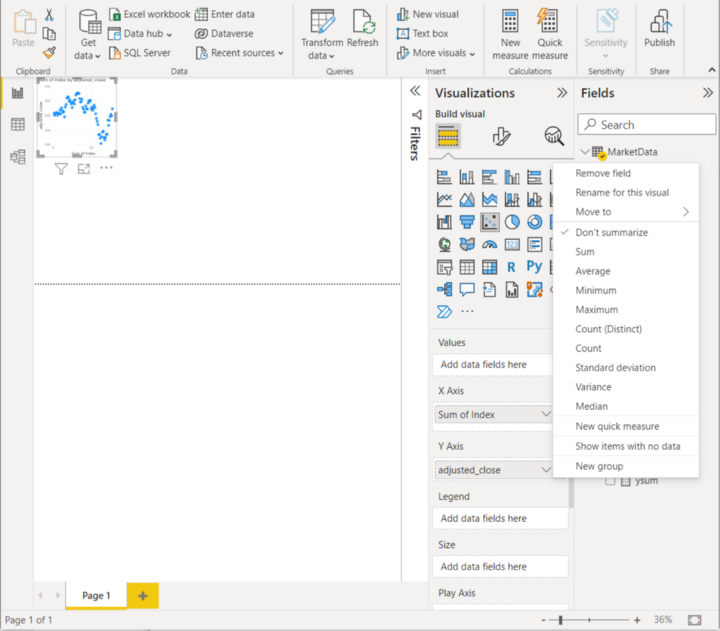
What we will want to do now is click on the magnifying class under Visualisations like we did with the forecasting example. We selected “Trend line” previously, but this time we want to select “Trend line”. You can leave the default values, but make sure you toggle it on. If all has gone to plan it should look something like this.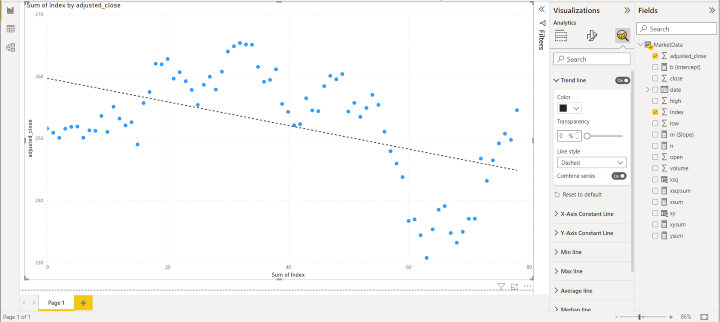
The next step is we want to create a nice way for a user to dynamically request their prediction. The way we do this is to go to the “Modeling” menu item at the top and then select “New parameter What if”. I’ve called mine “x (Days Since)”. If you use the same as me, then you won’t need to adjust the DAX formula I will provide next. I set a minimum of 80 because there is 80 days of data and I am only interesting in predicting a future price. I set 100 as the max as I didn’t want to go overboard 🙂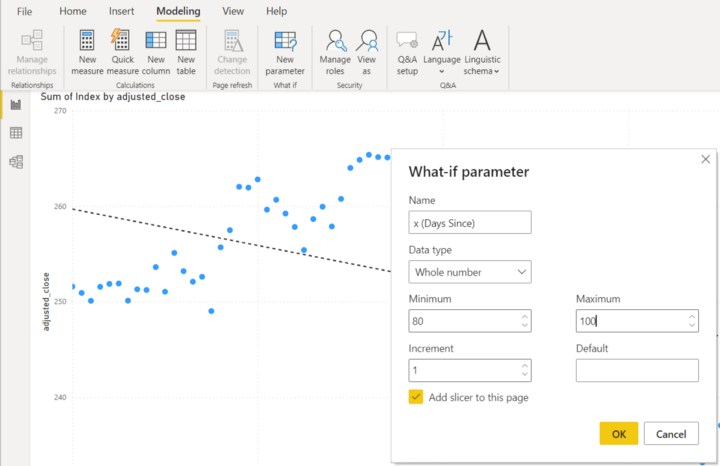
We will then want to go back to our data table section. It’s the same place we created our calculated columns and measures. We will want to create an additional measure called, “Predicted Price”.
Predicted Price =
([m (Slope)]*
'x (Days Since)'[x (Days Since) Value]+
[b (Intercept)]
)
This is why I said setting the same “What if” parameter name will save you some time. If you used something else, you will need to update the DAX formula above.
Once we have done that we can jump back to our user interface design. We are going to want to add something new now. It’s the label icon on the forth row, third from the left. It’s the icon with “123” on it. Add that to our user interface and drag the “Predicated Price” measure into the “Fields”.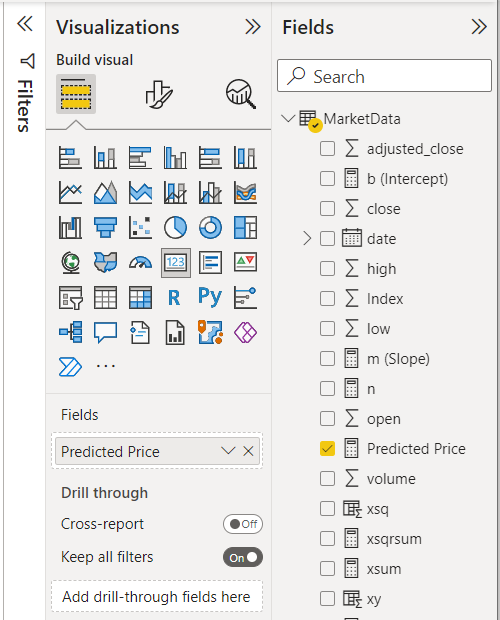
What will happen now is if we drag our “x (Days Since)” slider left and right we will see the “Predicted Price” automatically update. For example, I dragged the slider to 85, which would 5 days in the future as 80 is the current max. That is saying based on our current trend the price should be $243.06.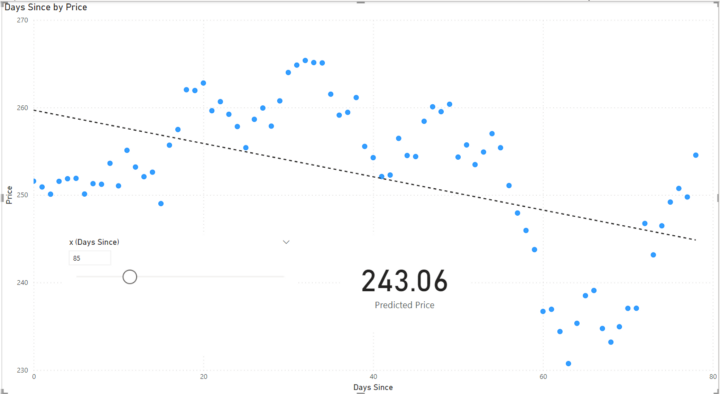
I hope you have found this article useful if you have not used Microsoft Power BI before, or maybe not for this purpose. With the built-in forecasting example and the linear regression DAX example, you should be more comfortable navigating around yourself now and creating great dashboards. Please don’t forget to clap for the article if learnt something new.

