

Trading with the help of candlestick charts is a very traditional yet effective way of trading assets. As it gained popularity in the trading arena, day traders started developing and using a wide array of strategies that used the candlestick charts at its core.
In this article, we are going to build one such momentum trading strategy with the help of candlesticks and backtest the strategy on Tesla stock in Python. Though it is possible to construct very complex strategies using candlesticks, we will be keeping our momentum strategy as simple as possible for the sake of understandability. With that said, let’s dive into the article.
Quick jump:
Importing Packages
Importing the required packages into the Python environment is a non-skippable step. The primary packages are going to be eodhd for extracting historical stock data, and Pandas for data formatting and manipulations. The secondary packages are going to be Math for mathematical functions and Termcolor for font customization (optional).
# IMPORTING PACKAGES

import pandas as pd
from eodhd import APIClient
from termcolor import colored as cl
import math
With the required packages imported into Python, we can proceed to fetch historical data for Tesla using EODHD’s eodhd Python library. Also, if you haven’t installed any of the imported packages, make sure to do so using the pip command in your terminal.
API Key Activation
It is essential to register the EODHD API key with the package in order to use its functions. If you don’t have an EODHD API key, firstly, head over to their website, then, finish the registration process to create an EODHD account, and finally, navigate to the ‘Settings’ page where you could find your secret EODHD API key. It is important to ensure that this secret API key is not revealed to anyone. You can activate the API key by following this code:
# API KEY ACTIVATION

api_key = '<YOUR API KEY>'
client = APIClient(api_key)
The code is pretty simple. In the first line, we are storing the secret EODHD API key into the api_key and then in the second line, we are using the APIClient class provided by the eodhd package to activate the API key and stored the response in the client variable.
Note that you need to replace <YOUR API KEY> with your secret EODHD API key. Apart from directly storing the API key with text, there are other ways for better security such as utilizing environmental variables, and so on.
Extracting Historical Data
Before heading into the extraction part, it is first essential to have some background about historical or end-of-day data. In a nutshell, historical data consists of information accumulated over a period of time. It helps in identifying patterns and trends in the data. It also assists in studying market behavior. Now, you can easily extract the historical data of Tesla using the eodhd package by following this code:
# EXTRACTING HISTORICAL DATA
tsla = client.get_historical_data('TSLA', 'd', '2023-05-01', '2023-11-01').drop(['symbol','interval','close'], axis = 1)
tsla.index = pd.to_datetime(tsla.index)
tsla = tsla.rename(columns = {'adjusted_close':'close'})
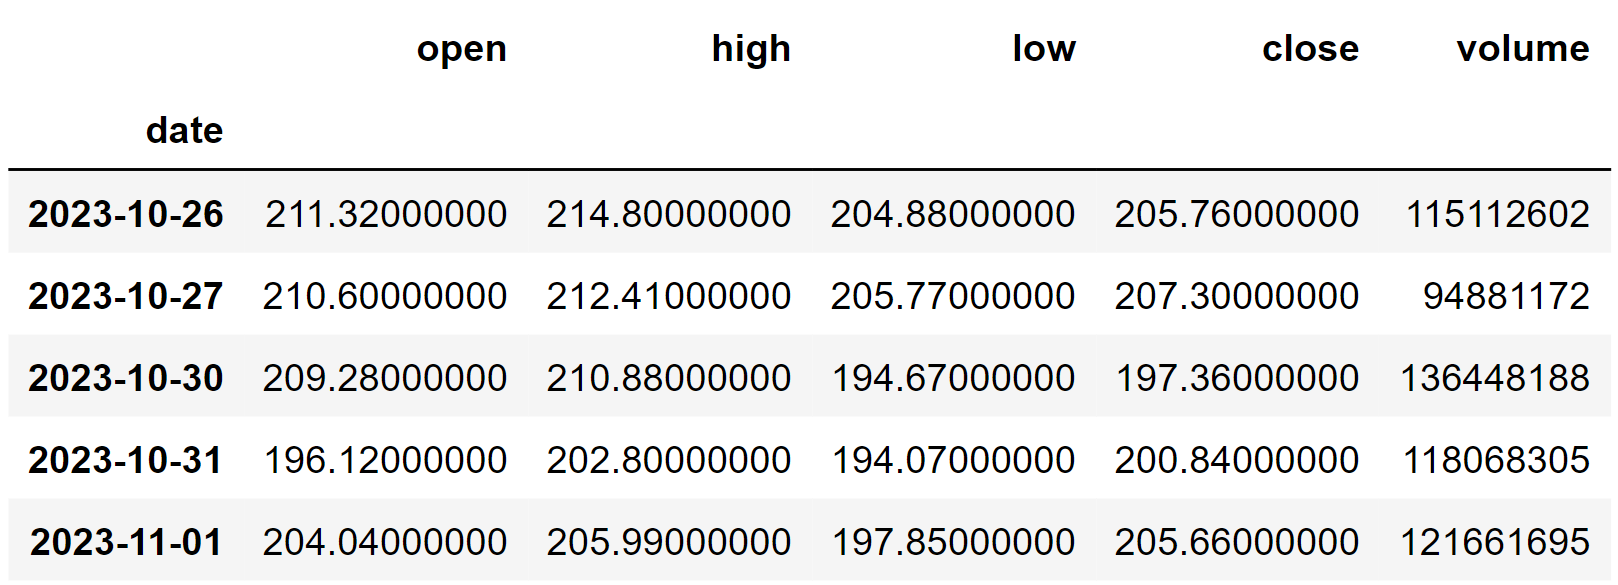
tsla.tail()The code used here is pretty straightforward. First, we are using the get_historical_data function provided by the eodhd package. This function takes the stock’s symbol, the time interval between the data points, and the starting and ending date of the dataframe. After that, we are performing some data manipulation processes to format and clean the extracted historical data. Here’s the final dataframe:
Backtesting the Candlestick Momentum Strategy
Before actually coding the strategy, it’s essential to have some background on the candlestick momentum strategy that we’re going to build. Here’s an explanation of the logic of the strategy in a simplified way:
We enter the market if: The closing price of the current candle is greater than the highest price of the previous three candles.
We exit the market if: The closing price of the current candle is less than the lowest price of the previous three candles.
As I mentioned before, this is a very simple momentum-based strategy and the following code backtests this strategy on the extracted historical data of Tesla:
# CREATING THE STRATEGY

def implement_strategy(df, investment):

    in_position = False
    equity = investment

    for i in range(3, len(df)):
        if df['close'][i] > df['high'][i-3] and df['close'][i] > df['high'][i-2] and df['close'][i] > df['high'][i-1] and in_position == False:
            no_of_shares = math.floor(equity/df.close[i])
            equity -= (no_of_shares * df.close[i])
            in_position = True
            print(cl('BUY: ', color = 'green', attrs = ['bold']), f'{no_of_shares} Shares are bought at ${df.close[i]} on {str(df.index[i])[:10]}')
        elif df['close'][i] < df['low'][i-3] and df['close'][i] < df['low'][i-2] and df['close'][i] < df['low'][i-1] and in_position == True:
            equity += (no_of_shares * df.close[i])
            in_position = False
            print(cl('SELL: ', color = 'red', attrs = ['bold']), f'{no_of_shares} Shares are bought at ${df.close[i]} on {str(df.index[i])[:10]}')
    if in_position == True:
        equity += (no_of_shares * df.close[i])
        print(cl(f'\nClosing position at {df.close[i]} on {str(df.index[i])[:10]}', attrs = ['bold']))
        in_position = False

    earning = round(equity - investment, 2)
    roi = round(earning / investment * 100, 2)
    print(cl(f'EARNING: ${earning} ; ROI: {roi}%', attrs = ['bold']))

implement_strategy(tsla, 100000)
This code is heavily inspired by the backtesting code written by Yong Hong Tan in his article about the SuperTrend indicator. A shoutout to him for this amazing code. The backtesting results are pretty interesting and these are the trades executed by the program:
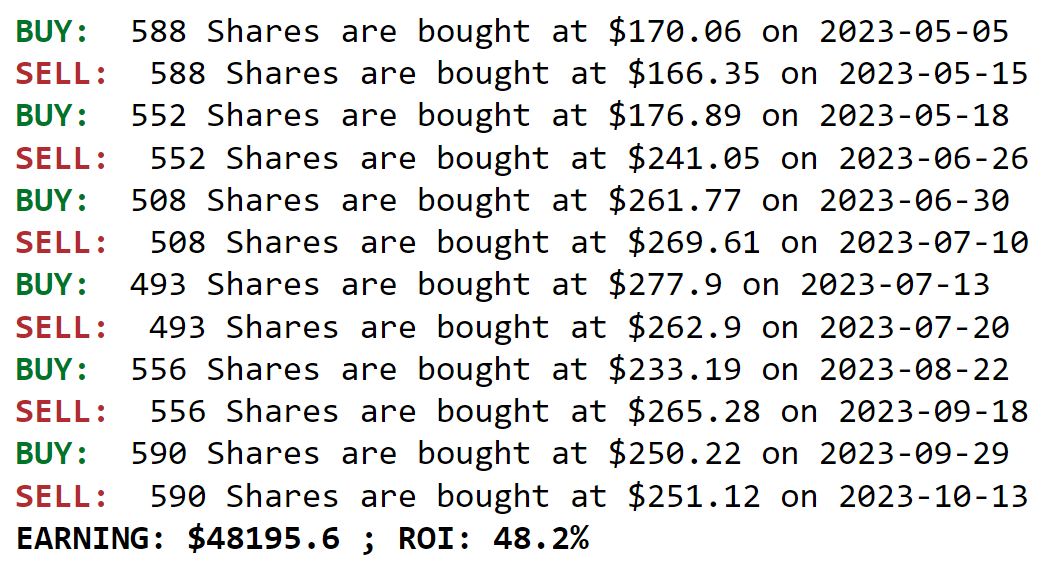
It can be observed that the program has made around 12 transactions within a timespan of 6 months which is totally fine. At the end of the specified backtesting timeframe, our strategy has made approximately $48K with an ROI of 48%. That’s great!
Testing the Candlestick Momentum Strategy on Different Timeframes
This is an optional step for validating the strategy’s performance and check its suitability for different timeframes. Let’s start off with backtesting the strategy on Tesla’s 1h intraday data.
tsla_1h = client.get_historical_data('TSLA', '1h', '2023-10-15', '2023-11-01').drop(['symbol','interval','gmtoffset','epoch'], axis = 1)
tsla_1h.index = pd.to_datetime(tsla_1h.index)

implement_strategy(tsla_1h, 100000)
In the above code, we’re first using the get_historical_data function to extract the 1h intraday data of Tesla. To backtest the strategy on this data, we’re using the implement_strategy function which we defined earlier to conduct backtest on the 1-day historical. These are the backtesting results on 1h intraday data of Tesla:
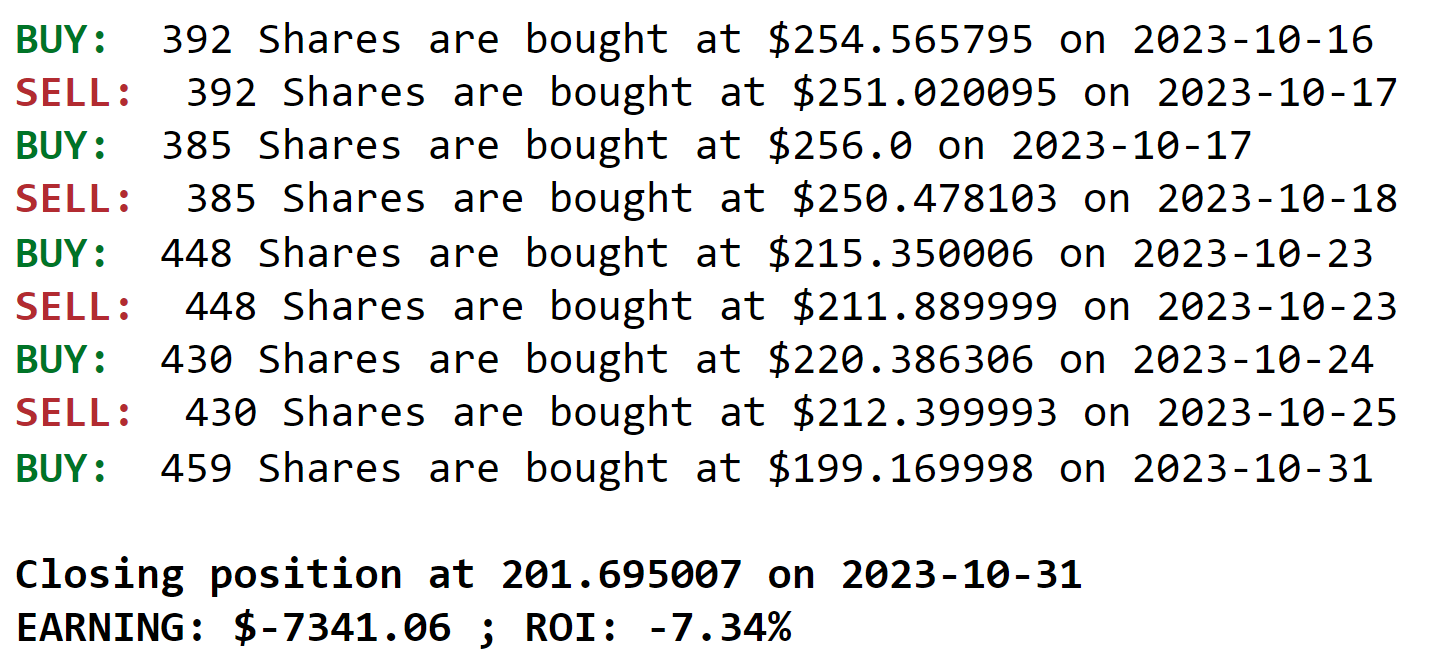
The results are pretty contrasting to those of the 1-day historical data where we had an ROI of 48%, whereas here, we are facing a loss $7.3K. For further insights, let’s try backtesting the same strategy on 5-mins intraday data of Tesla.
tsla_5m = client.get_historical_data('TSLA', '5m', '2023-10-27', '2023-11-01').drop(['symbol','interval','gmtoffset','epoch'], axis = 1)
tsla_5m.index = pd.to_datetime(tsla_5m.index)

implement_strategy(tsla_5m, 100000)
The code is almost the same as the 1h timeframe except here, we’re extracting and running the backtest on 5-mins intraday data. Here are the backtesting results:
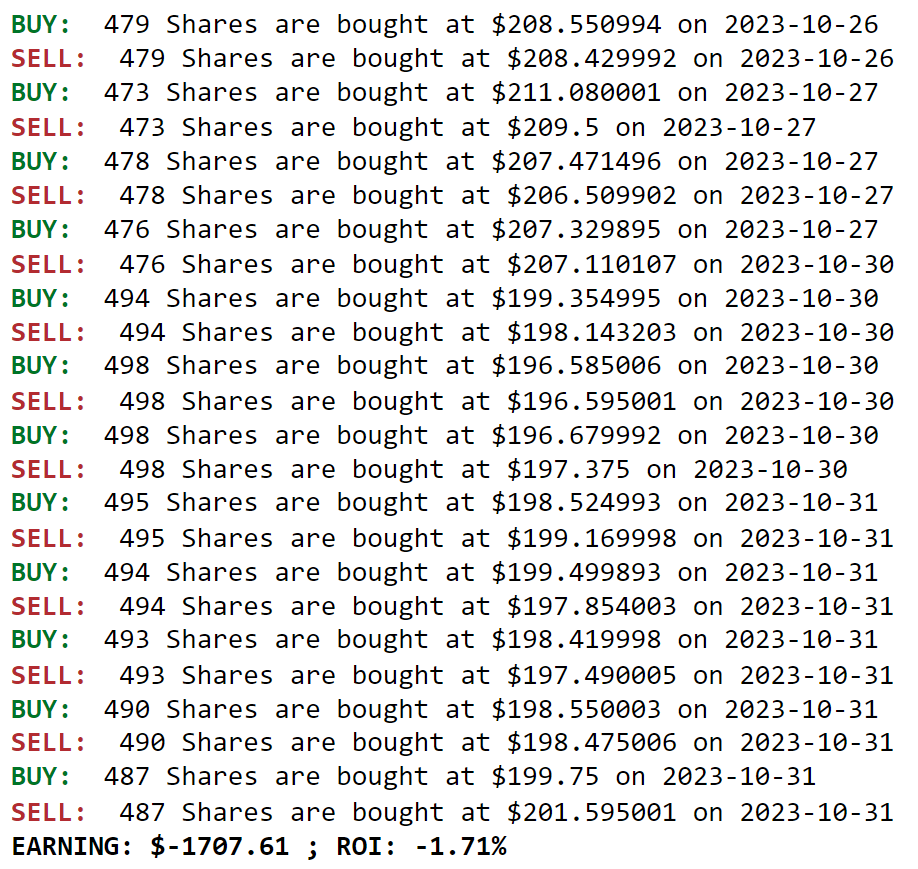
As you can see, the strategy has executed a huge number of trades and there is a high chance that a lot of them are executed based on false signals which can be a critical reason behind the loss we faced.
The reason behind backtesting the strategy on different timeframes is to expose the strategy to varied situations and test its performance during those times. From our observations, it is evident that the strategy’s performance is phenomenal on the 1-day historical data and the results on the 1h and 5-mins data are relatively poor. Thus, it can be confidently said that our momentum strategy is most suitable for swing trading than for day trading.
Conclusion
In this article, we learned to construct a very simple candlestick momentum strategy. We backtested the strategy on Tesla’s historical data with timeframes to better evaluate the efficiency of the strategy.
Though we went through an extensive process of coding, there are still a lot of scope for improvements. For example, to make the backtesting results more reliable, transaction costs can be amounted for each trade the program executes. Then, several risk management approaches can be deployed for ensuring safe method of trading. These are some ways to improve the overall framework and there are many more to be explored.
With that said, you’ve reached the end of the article. Hope you learned something new and useful today. Thank you very much for your time. Happy backtesting!