

Introduction
The Fintech development demands precise and clean data, especially when it comes to financial data processing. As the industry evolves, developers face increasingly complex challenges, from maintaining calculation accuracy to managing the nuances of global markets. This guide aims to address these hurdles head-on, offering practical Python-based solutions.
While understanding data cleaning and preprocessing is valuable, EODHD’s pre-validated and cleaned data feeds offer a more efficient path for production environments. By leveraging EODHD’s financial data ecosystem, developers can bypass the time-consuming process of building custom data pipelines and focus on creating innovative Fintech applications.
Throughout this exploration, we’ll delve into common financial data processing challenges and demonstrate how EODHD’s APIs can streamline your workflow. From real-time market data accessible via WebSockets to extensive historical databases perfect for backtesting, EODHD’s offerings cover the full spectrum of fintech data needs for 150,000+ tickers across 70+ worldwide exchanges.
Quick jump:
Setting Up the Python Environment
As Python has become one of the dominant languages for data processing we choose to focus on this language. We do acknowledge that applications are developed in a wide variety of languages. EODHD’s team is working on making sure our APIs are compatible with them. You can find supported libraries for different languages and articles on how to build applications on our webpage.
Before diving into financial data processing, let’s set up our Python environment. We’ll use the following libraries:
import pandas as pd
import numpy as np
from datetime import datetime
import pytz
import requests
import re
from dateutil.parser import parse
import matplotlib.pyplot as plt
from scipy import stats

# EODHD API setup
API_KEY = 'demo'
BASE_URL = 'https://eodhistoricaldata.com/api'
Ensure you have these libraries installed. Please replace ‘demo’ with your actual EODHD API key from your dashboard. The ‘demo’ key provides data only for AAPL, TSLA, AMZN, and MSFT tickers.
To ensure proper work of the code snippets in the article make sure that this part of the code is loaded into your kernel.
Handling Timestamps and Time Zones
One of the first challenges in financial data processing is dealing with timestamps and time zones. Global markets operate in different time zones, and mishandling this can lead to significant errors. Let’s create a function to normalize timestamps to UTC:
def normalize_timestamp(timestamp, from_tz):
    local_dt = pytz.timezone(from_tz).localize(datetime.strptime(timestamp, "%Y-%m-%d %H:%M:%S"))
    return local_dt.astimezone(pytz.UTC).strftime("%Y-%m-%d %H:%M:%S")

# Example usage
nyse_timestamp = "2023-09-22 09:30:00"
utc_timestamp = normalize_timestamp(nyse_timestamp, "America/New_York")
print(f"NYSE time: {nyse_timestamp}, UTC time: {utc_timestamp}")
This function converts a timestamp from a given time zone to UTC, ensuring consistency across all data points. Using the data provided by EODHD you can be certain that everything is already adjusted for one standard. We provide real-time, live, and intraday data with Unix timestamps, which would make working with output much easier.
Fetching Financial Data with EODHD API
Now, let’s integrate EODHD’s API to fetch real financial data:
def get_stock_data(symbol, start_date, end_date):
    endpoint = f"{BASE_URL}/eod/{symbol}"
    params = {
        'api_token': API_KEY,
        'from': start_date,
        'to': end_date,
        'fmt': 'json'
    }
    response = requests.get(endpoint, params=params)
    if response.status_code == 200:
        return pd.DataFrame(response.json())
    else:
        raise Exception(f"API request failed with status code {response.status_code}")

# Example usage
apple_data = get_stock_data('AAPL', '2023-01-01', '2023-12-31')
print(apple_data.head())
This function fetches historical stock data from EODHD’s end-of-day API and returns it as a pandas DataFrame, ready for further processing.
By mastering these fundamental concepts and techniques, you’ll be well-equipped to handle the basic challenges of financial data processing. In the next part, we’ll delve into more advanced topics, including data formatting, validation, and handling missing data.
IMPORTANT! The get_stock_data function will be used in other code snippets, make sure you are loading it into your kernel before running the snippet.
Data Formatting and Validation
In this section, we’ll explore techniques for handling data format inconsistencies, implementing robust validation, and dealing with missing data and outliers in financial time series.
Dealing with Data Format Inconsistencies
Financial data often comes from various sources with different formats. Let’s create a flexible date parser that can handle multiple date formats:
from dateutil.parser import parse

def parse_date(date_string):
    try:
        return parse(date_string, dayfirst=False)
    except ValueError:
        return parse(date_string, dayfirst=True)

# Example usage
dates = ["05/04/2023", "30/04/2023", "2023-04-15"]
parsed_dates = [parse_date(date) for date in dates]
for original, parsed in zip(dates, parsed_dates):
    print(f"Original: {original}, Parsed: {parsed.strftime('%Y-%m-%d')}")
This function attempts to parse dates in multiple formats, accommodating both US (MM/DD/YYYY) and international (DD/MM/YYYY) date formats.
For numerical data, different regions may use different decimal and thousand separators. Here’s a function to handle these variations:
import re

def parse_number(number_string):
    cleaned = re.sub(r'[^\d,.-]', '', number_string)
    if ',' in cleaned and '.' in cleaned:
        if cleaned.rindex(',') > cleaned.rindex('.'):
            # European format (1.234,56)
            cleaned = cleaned.replace('.', '').replace(',', '.')
        else:
            # US format (1,234.56)
            cleaned = cleaned.replace(',', '')
    elif ',' in cleaned:
        # Could be European format without thousands separator
        cleaned = cleaned.replace(',', '.')
    return float(cleaned)

# Example usage
numbers = ["1,234.56", "1.234,56", "1234.56", "1234,56"]
parsed_numbers = [parse_number(num) for num in numbers]
for original, parsed in zip(numbers, parsed_numbers):
    print(f"Original: {original}, Parsed: {parsed}")
This function handles different numerical notations, ensuring consistent parsing regardless of the input format.
Implementing Robust Data Validation
Data validation is crucial in financial applications. Let’s create a validation class for financial data:
class FinancialDataValidator:
    def __init__(self, rules=None):
        self.rules = rules or {}

    def add_rule(self, field, rule):
        self.rules[field] = rule

    def validate(self, data):
        errors = []
        for field, rule in self.rules.items():
            if field in data:
                if not rule(data[field]):
                    errors.append(f"Validation failed for {field}: {data[field]}")
        return errors

# Example usage
validator = FinancialDataValidator()
validator.add_rule('close', lambda x: x > 0)
validator.add_rule('volume', lambda x: x >= 0)

data = {'close': 100.5, 'volume': 1000}
errors = validator.validate(data)
if errors:
    print("Validation errors:", errors)
else:
    print("Data is valid")
This class allows you to define custom validation rules for different fields in your financial data.
Handling Missing Data and Outliers
Financial time series often contain missing values or outliers. Here’s how to handle these issues using pandas:
def clean_financial_data(df):
    # Handle missing values
    df['close'] = df['close'].fillna(method='ffill')  # Forward fill prices
    df['volume'] = df['volume'].fillna(0)  # Fill missing volume with 0

    # Detect and handle outliers (using Z-score method)
    z_scores = stats.zscore(df['close'])
    abs_z_scores = np.abs(z_scores)
    filtered_entries = (abs_z_scores < 3)  # Keep only entries with Z-score < 3
    df['close'] = df['close'][filtered_entries]

    return df

# Example usage with EODHD data
symbol = 'AAPL'
start_date = '2023-01-01'
end_date = '2023-12-31'

raw_data = get_stock_data(symbol, start_date, end_date)
cleaned_data = clean_financial_data(raw_data)
print(cleaned_data.describe())
This function fills missing values and removes outliers based on the Z-score method. It’s particularly useful for preparing data for analysis or model training.
By implementing these techniques, you can ensure that your financial data is consistently formatted, validated, and cleaned. This forms a solid foundation for more advanced data processing and analysis tasks, which we’ll explore in the next part of this article.
Remember, while these methods are powerful, always consider the specific requirements of your financial application and regulatory environment when handling and transforming data.
IMPORTANT! Please make sure that the get_stock_data function from the ‘Fetching Financial Data with EODHD API’ section is loaded into your kernel before running this snippet.
Advanced Data Processing
In this section, we’ll delve into more complex aspects of financial data processing, including handling corporate actions, calculating key financial metrics, and implementing efficient data structures for large datasets.
Processing Corporate Actions
Corporate actions such as stock splits and dividends can significantly impact historical data analysis. Let’s create functions to adjust for these events:
def adjust_for_split(df, split_ratio, split_date):
    """
    Adjust historical stock data for a stock split.
    """
    df = df.copy()
    df.loc[:split_date, ['open', 'high', 'low', 'close']] *= split_ratio
    df.loc[:split_date, 'volume'] /= split_ratio
    return df

def adjust_for_dividend(df, dividend_amount, ex_dividend_date):
    """
    Adjust historical stock data for dividends.
    """
    df = df.copy()
    df.loc[:ex_dividend_date, ['open', 'high', 'low', 'close']] -= dividend_amount
    return df

# Example usage with EODHD data
symbol = 'AAPL'
start_date = '2020-01-01'
end_date = '2023-12-31'

data = get_stock_data(symbol, start_date, end_date)
data['date'] = pd.to_datetime(data['date'])
data.set_index('date', inplace=True)

# Adjust for Apple's 4-for-1 stock split on August 31, 2020
split_adjusted = adjust_for_split(data, 0.25, '2020-08-28')

# Adjust for a dividend
dividend_adjusted = adjust_for_dividend(split_adjusted, 0.23, '2023-05-12')

print(dividend_adjusted.head())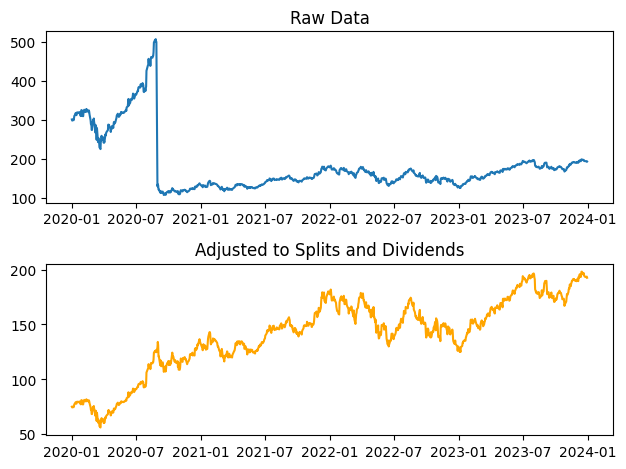
These functions allow you to retroactively adjust historical data for splits and dividends, ensuring consistency in your analysis.
IMPORTANT! Please make sure that the get_stock_data function from the ‘Fetching Financial Data with EODHD API’ section is loaded into your kernel before running this snippet.
Calculating Key Financial Metrics
Financial analysis often requires the calculation of various metrics. EODHD’s Technical Indicators API provides clean preprocessed technicals for equities. However, In case you are developing your own process, you can implement some common ones yourself:
def calculate_returns(df):
    """Calculate daily and cumulative returns."""
    df['daily_return'] = df['close'].pct_change()
    df['cumulative_return'] = (1 + df['daily_return']).cumprod() - 1
    return df

def calculate_volatility(df, window=252):
    """Calculate rolling volatility."""
    df['volatility'] = df['daily_return'].rolling(window=window).std() * np.sqrt(window)
    return df

def calculate_moving_averages(df):
    """Calculate 50-day and 200-day moving averages."""
    df['MA50'] = df['close'].rolling(window=50).mean()
    df['MA200'] = df['close'].rolling(window=200).mean()
    return df

# Example usage
metrics_df = dividend_adjusted.pipe(calculate_returns)\
                              .pipe(calculate_volatility)\
                              .pipe(calculate_moving_averages)

print(metrics_df.tail())
These functions calculate common financial metrics like returns, volatility, and moving averages, which are essential for many financial analyses and trading strategies.
Efficient Data Structures for Large Datasets
When dealing with large financial datasets, efficiency becomes crucial. Let’s explore using numpy arrays for improved performance:
class FinancialTimeSeries:
    def __init__(self, dates, opens, highs, lows, closes, volumes):
        self.dates = np.array(dates)
        self.data = np.column_stack((opens, highs, lows, closes, volumes))

    def get_returns(self):
        closes = self.data[:, 3]
        return np.diff(closes) / closes[:-1]

    def get_volatility(self, window=252):
        returns = self.get_returns()
        return np.std(returns[-window:]) * np.sqrt(window)

    def get_moving_average(self, window=50):
        closes = self.data[:, 3]
        return np.convolve(closes, np.ones(window), 'valid') / window

# Example usage with EODHD data
data = get_stock_data(symbol, start_date, end_date)
ts = FinancialTimeSeries(
    data['date'], data['open'], data['high'],
    data['low'], data['close'], data['volume']
)

print(f"Latest return: {ts.get_returns()[-1]}")
print(f"Volatility: {ts.get_volatility()}")
print(f"50-day MA: {ts.get_moving_average()[-1]}")
This FinancialTimeSeries class uses numpy arrays for efficient storage and computation of financial data. It’s particularly useful when working with large datasets where performance is a concern.
IMPORTANT! Please make sure that the get_stock_data function from the ‘Fetching Financial Data with EODHD API’ section is loaded into your kernel before running this snippet.
Integrating with EODHD for Fundamental Data
Let’s extend our analysis by incorporating fundamental data from EODHD:
def get_fundamental_data(symbol):
    endpoint = f"{BASE_URL}/fundamentals/{symbol}"
    params = {'api_token': API_KEY}
    response = requests.get(endpoint, params=params)
    if response.status_code == 200:
        return response.json()
    else:
        raise Exception(f"API request failed with status code {response.status_code}")

# Example usage
fundamental_data = get_fundamental_data('AAPL')
pe_ratio = fundamental_data['Valuation']['TrailingPE']
market_cap = fundamental_data['Highlights']['MarketCapitalization']

print(f"P/E Ratio: {pe_ratio}")
print(f"Market Cap: ${market_cap:,}")
This function fetches fundamental data from EODHD, allowing you to incorporate metrics like P/E ratio and market capitalization into your analysis.
By mastering these advanced data processing techniques, you’ll be well-equipped to handle complex financial data analysis tasks.
Applications and EODHD Integration
In this final section, we’ll explore practical applications of the techniques we’ve covered, demonstrating how to build a basic trading algorithm, implement a real-time financial dashboard, and fully leverage EODHD’s APIs for robust financial data processing.
Building a Basic Trading Algorithm
Let’s create a simple moving average crossover strategy using EODHD’s historical data:
def moving_average_crossover_strategy(symbol, short_window, long_window):
    # Fetch historical data
    data = get_stock_data(symbol, '2020-01-01', '2023-12-31')
    df = pd.DataFrame(data)
    df['date'] = pd.to_datetime(df['date'])
    df.set_index('date', inplace=True)

    # Calculate moving averages
    df['short_ma'] = df['close'].rolling(window=short_window).mean()
    df['long_ma'] = df['close'].rolling(window=long_window).mean()

    # Generate buy/sell signals
    df['signal'] = 0
    df.loc[df['short_ma'] > df['long_ma'], 'signal'] = 1
    df.loc[df['short_ma'] < df['long_ma'], 'signal'] = -1

    # Calculate strategy returns
    df['returns'] = df['close'].pct_change()
    df['strategy_returns'] = df['signal'].shift(1) * df['returns']

    # Plot results
    plt.figure(figsize=(12, 6))
    plt.plot(df.index, df['close'], label='Close Price')
    plt.plot(df.index, df['short_ma'], label=f'{short_window}-day MA')
    plt.plot(df.index, df['long_ma'], label=f'{long_window}-day MA')
    plt.plot(df[df['signal'] == 1].index, df['close'][df['signal'] == 1], '^', markersize=10, color='g', label='Buy Signal')
    plt.plot(df[df['signal'] == -1].index, df['close'][df['signal'] == -1], 'v', markersize=10, color='r', label='Sell Signal')
    plt.title(f'Moving Average Crossover Strategy for {symbol}')
    plt.legend()
    plt.show()

    # Print performance metrics
    cumulative_returns = (1 + df['strategy_returns']).cumprod()
    total_return = cumulative_returns.iloc[-1] - 1
    sharpe_ratio = df['strategy_returns'].mean() / df['strategy_returns'].std() * np.sqrt(252)

    print(f"Total Return: {total_return:.2%}")
    print(f"Sharpe Ratio: {sharpe_ratio:.2f}")

# Run the strategy
moving_average_crossover_strategy('AAPL', short_window=50, long_window=200)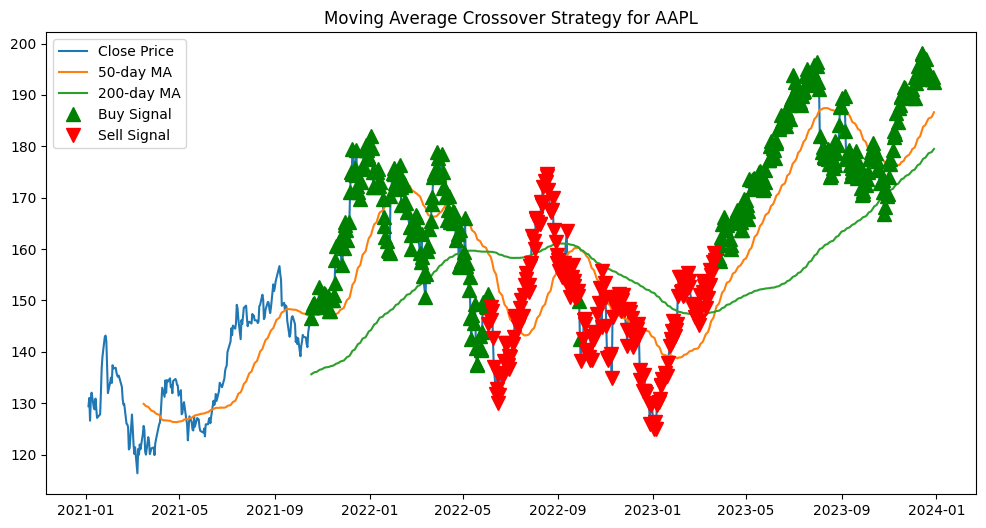
This script implements a basic moving average crossover strategy, visualizes the buy/sell signals, and calculates performance metrics. You can read more about the algorithm in our article.
IMPORTANT! Please make sure that the get_stock_data function from the ‘Fetching Financial Data with EODHD API’ section is loaded into your kernel before running this snippet.
Conclusion
Throughout this comprehensive guide, we’ve explored the intricate world of financial data processing using Python, demonstrating how EODHD’s robust APIs can serve as the backbone for sophisticated fintech applications.
The journey we’ve taken mirrors the commitment to data quality and processing excellence that EODHD upholds, as detailed in the “Data Processing in Delivering High-Quality Financial Data” article. EODHD’s commitment to data quality aligns perfectly with the needs of fintech developers. Our APIs provide not just raw data, but a foundation of accuracy and reliability upon which innovative financial applications can be built.
For developers looking to further enhance their skills and leverage EODHD’s capabilities, we recommend exploring the following additional resources:
- EODHD API Documentation: Comprehensive guides on all our API endpoints and data feeds.
- EODHD GitHub Repository: Sample code and libraries for various programming languages.
- EODHD Community Forum: A place to connect with other developers, share insights, and get support.
We invite you to explore our full range of financial data services and to join our community of innovative fintech developers. Together, we can push the boundaries of what’s possible in financial technology, driven by the power of accurate, comprehensive, and timely data. Whether you’re building a personal trading algorithm, developing a comprehensive financial analysis platform, or creating the next groundbreaking fintech application, EODHD’s team looks forward to seeing the amazing applications you’ll build with EODHD’s data at their core.
Feel free to contact our support team at support@eodhistoricaldata.com for any questions or current discount offers. We’re happy to assist you through the process of leveraging EODHD’s data to elevate your investment workflow