

EODHD API’s recently added US stock tick data to their API, but what is it? Stock tick data is granular and records each individual trade or quote, including the price, volume, and timestamp, as it happens in real-time. It is used primarily by high-frequency traders and institutions for real-time trading strategies, where split-second decisions matter. It also provides insights into market depth, showing the bid and ask prices and quantities for a particular stock at any given moment. Stock tick data is particularly useful for algorithmic trading strategies that involve making rapid, automated trading decisions based on real-time market conditions. It can also help in risk management by providing detailed information on price movements and trade execution.
Quick jump:
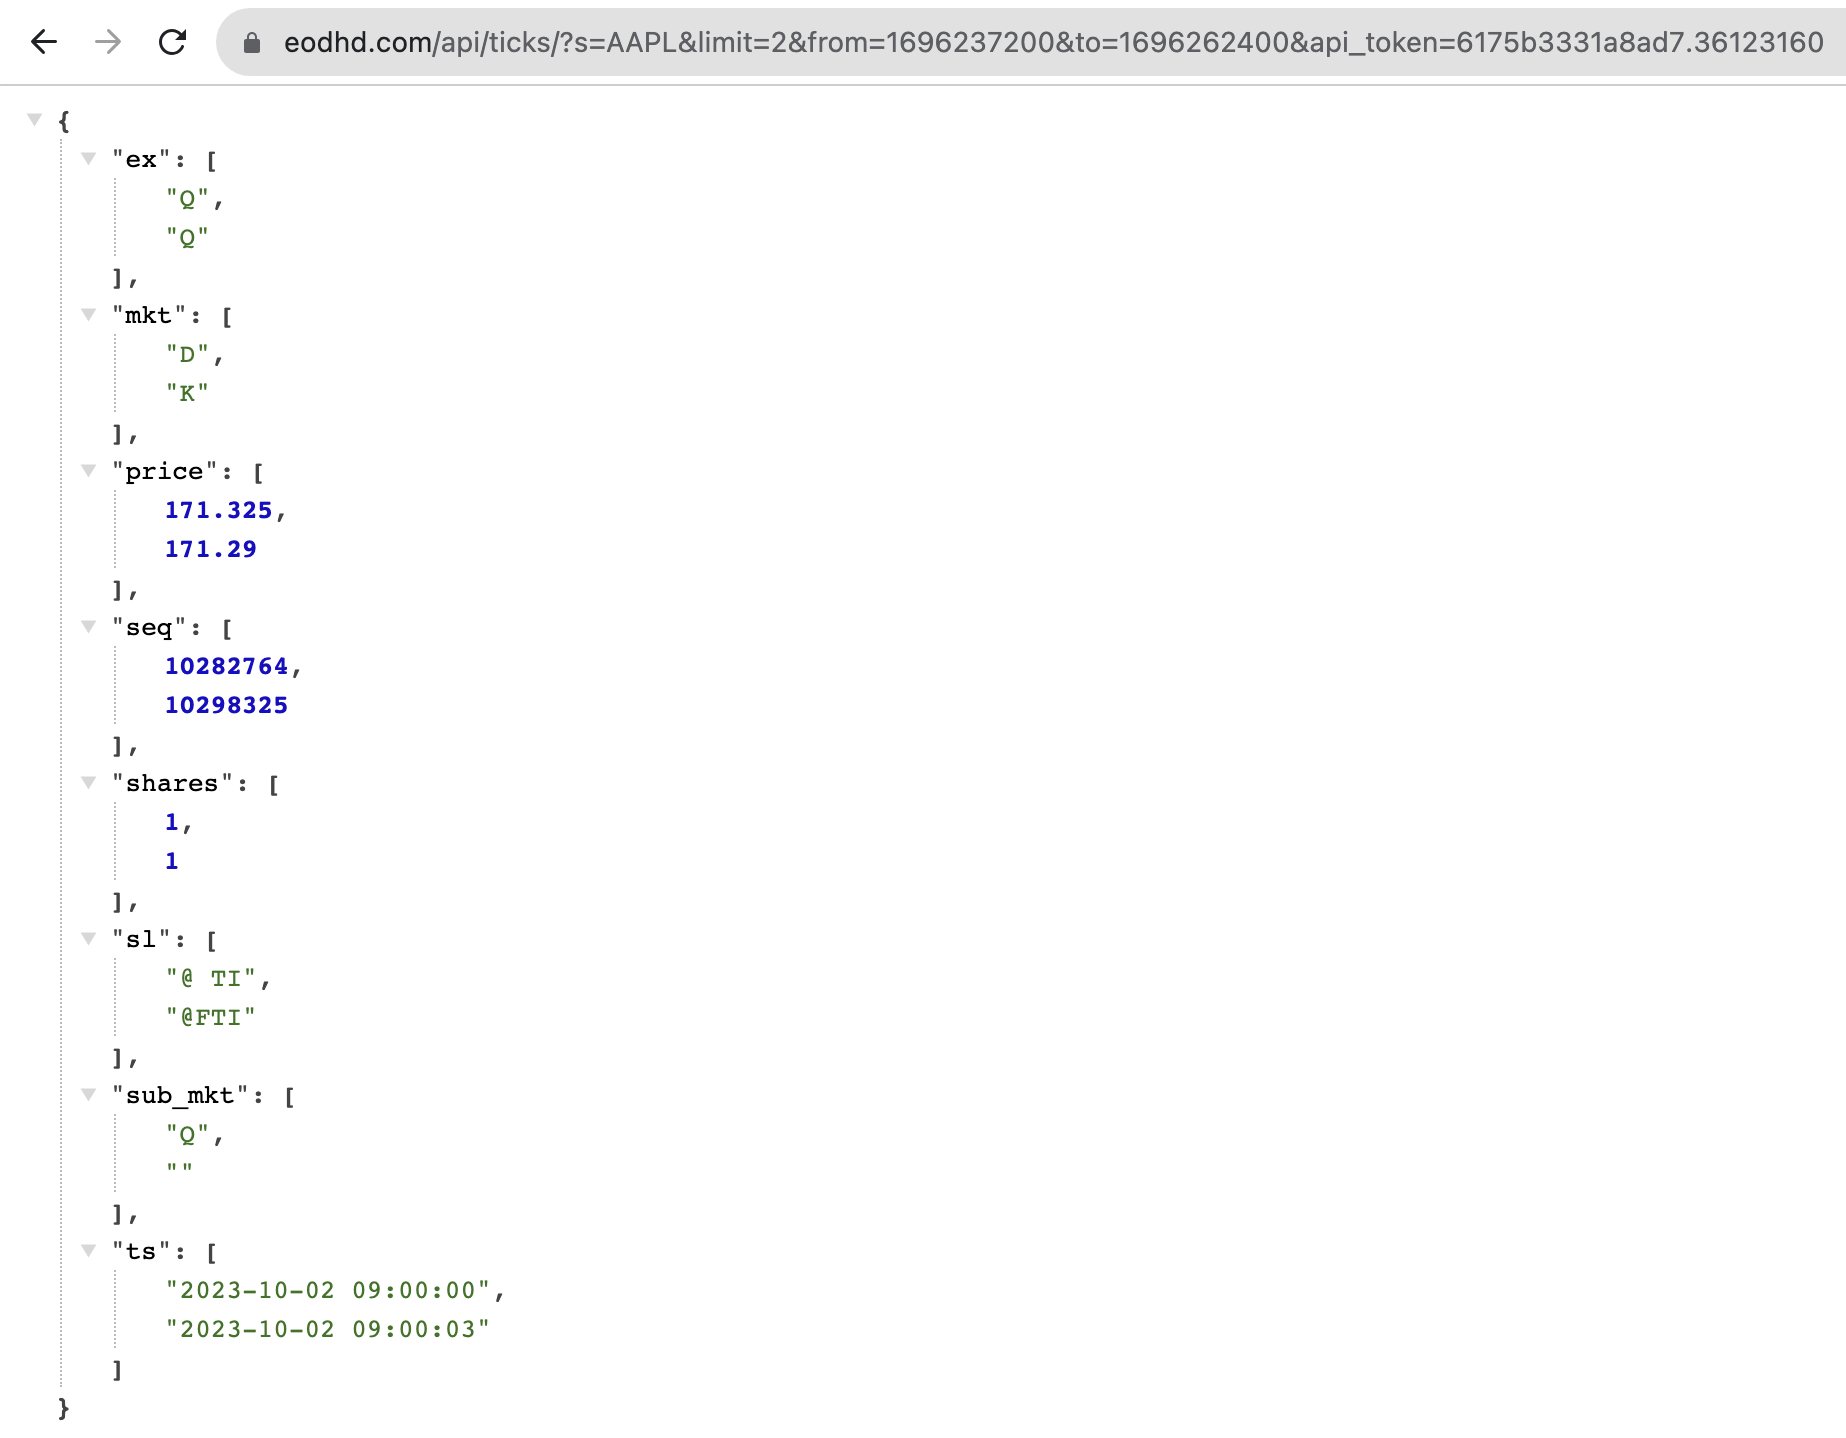
I’ve used the demo API key for testing which only works for the Apple Inc. (AAPL.US ) ticker. I’m also limiting the response to two entries to make it easier to read. The API returns a max limit of 10000 records so the date range can’t be too wide.
As per the documentation that can be found here, the keys above represent the following fields.
- ex – the exchange ticker is listed on
- mkt – market where trade took place
- price – the price of the transaction
- seq – trade sequence number
- shares – shares in transaction
- sl – sales condition
- ts – timestamp
- sub_mkt – sub-market where trade took place
Stock tick data in some sense in similar to a Blockchain ledger in that it records transactions or events. Each “tick” represents a trade and records all significant information of the trade.
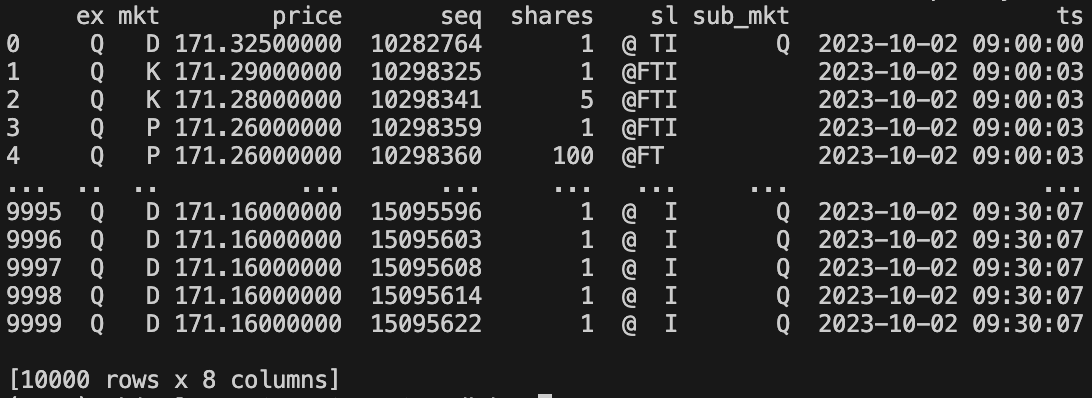
The API response represented as a Pandas Dataframe looks like this.
Stock tick data is a time-series which means we can use some fancy prediction and forecasting tools and techniques like Facebook Prophet or the Seasonal ARIMA model.
Facebook Prophet
If you have not heard of Facebook Prophet, you can find further information about it here. It allows you to do forecasting at scale using a Python library.
Firstly, make sure you have “prophet” Python library installed, not “fbprophet” as you would expect. It requires “pystan” that doesn’t install automatically.
% python3 -m pip install pystan prophet -UFacebook Prophet expects only two inputs. The time series as “ds” and the prediction variable as “y”.
My dataframe above is called “df”, and for simplicity I’ll just rename “ts” to “ds” and “price” to “y”.
df.rename(columns={'ts': 'ds', 'price': 'y'}, inplace=True)The Prophet code is fairly straight forward too.
model = Prophet()
model.fit(df)
future = model.make_future_dataframe(periods=10, freq="S")
forecast = model.predict(future)
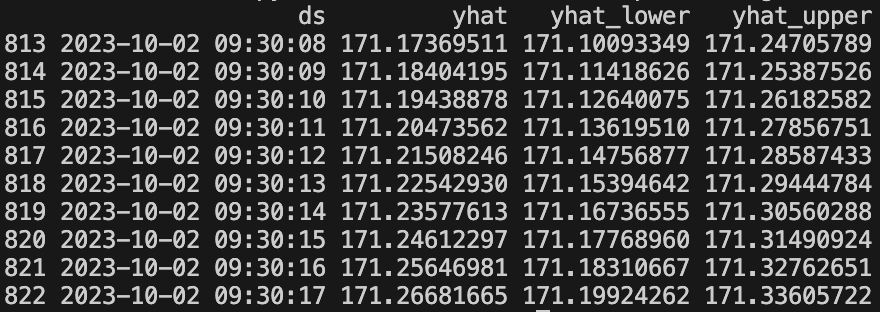
forecasted_prices = forecast[["ds", "yhat", "yhat_lower", "yhat_upper"]].tail(10)
print(forecasted_prices)
In the code above you will see I set the frequency “freq” to “S“. This is because our time series is in seconds. If you were applying this to another time series, you probably want to check the series is still seconds or adjust it accordingly.
The “yhat” is commonly used in statistical modelling to denote a predicted value. In our example, the “yhat” is the price we are predicting. “yhat_lower” and “yhat_upper” is our confidence level.
Facebook Prophet is really effective for forecasting and making predictions on large sets of data. The downside is it can be a little fiddly to install. For example, it’s not obvious you need to install “pystan” as well. It is possible you may have dependancy issues as well. If you have any trouble try and installing these first: Cython, numpy, pandas, matplotlib, and setuptools.
Seasonal ARIMA Model
The Seasonal Autoregressive Integrated Moving Average (Seasonal ARIMA or SARIMA) model is an extension of the ARIMA model to include seasonality components. You can find more information about it here.
This is more complicated to use than Facebook Prophet as it’s a lot more configurable. I have done a lot of testing with SARIMA in my crypto trading bots and in the short term it’s scarily accurate. For example, predicting the next 3-10 data points it’s really good at.
If we want to carry out a similar exercise with SARIMA we will first need to install the Python libraries called “matplotlib” and “statsmodels“.
% python3 -m pip install matplotlib statsmodelsThe code will then look like this.
import pandas as pd
import numpy as np
import matplotlib.pyplot as plt
from statsmodels.tsa.statespace.sarimax import SARIMAX

df.set_index("ts", inplace=True)
model = SARIMAX(df["price"], order=(1, 1, 1), seasonal_order=(1, 1, 1, 12))
results = model.fit(disp=False)

forecasts = results.get_forecast(steps=10)
mean_forecast = forecasts.predicted_mean
conf_int = forecasts.conf_int()

print(mean_forecast)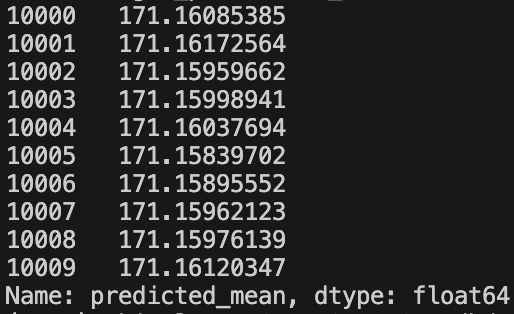
SARIMA allows you to specify the time series feature and the predicted variable. We don’t need to rename it to “ds” and “y“, we can just use “ts” and “price“. You do however need to make sure that you set the index of the dataframe as the timestamp.
Having a decent amount of data to use to model helps, but forecasting too far into the future becomes unreliable. At least from my experience with it, but to be fair I’ve mainly used it with crypto trading which is very unpredictable. With more stable stocks or other financial data it should do pretty well.
It is interesting that Facebook Profit also predicts the timestamp, whereas ARIMA just gives you the next n values. In this case 10.