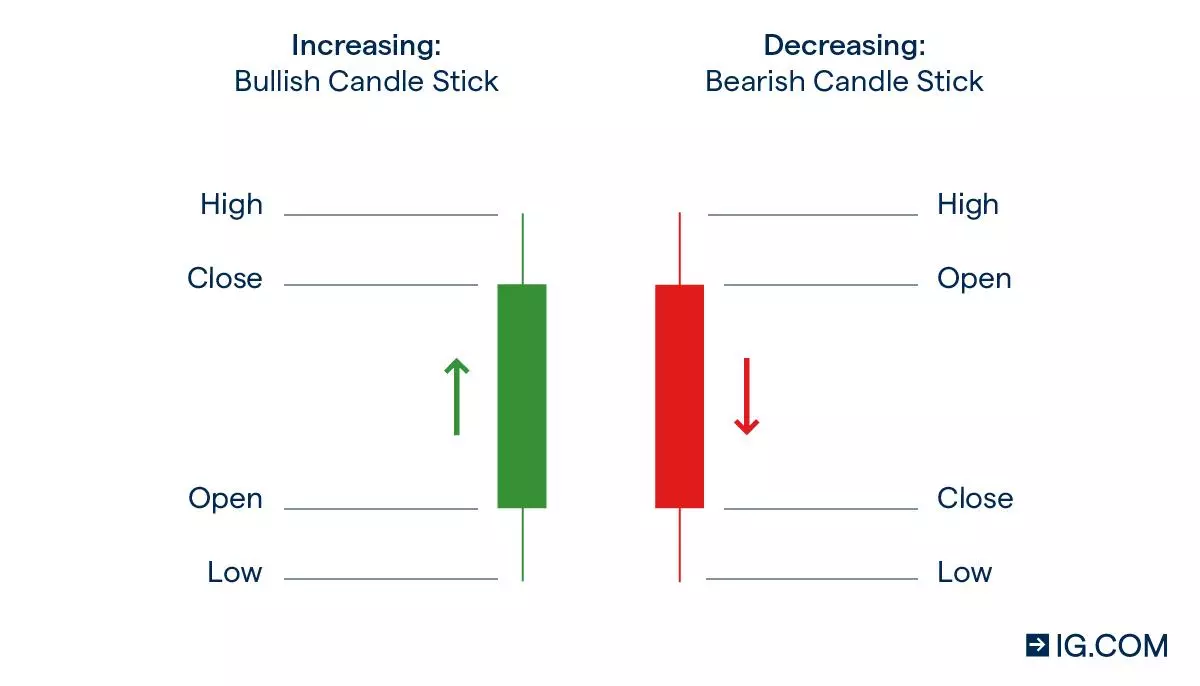
In order to discuss this topic of Practical Guide to Automated Detection Trading Patterns with Python, we need to introduce the basics first. I’m sure everyone is familiar with what a trading graph looks like, often represented with green and red bars forming a line graph. There is a lot of data and information condensed into this simple shape. A candle represents one interval of data E.g. one hour on the graph. It will contain four vital pieces of information. The Open, High, Low, and Close for the interval E.g. hour. This is often referred to as OHLC data. The candle will be displayed green if the candle / hour has an Close higher than the Open, and red if the Close is lower than the Open. This is better explained by the image below and hope this enjoy this Practical Guide to Automated Detection Trading Patterns with Python.

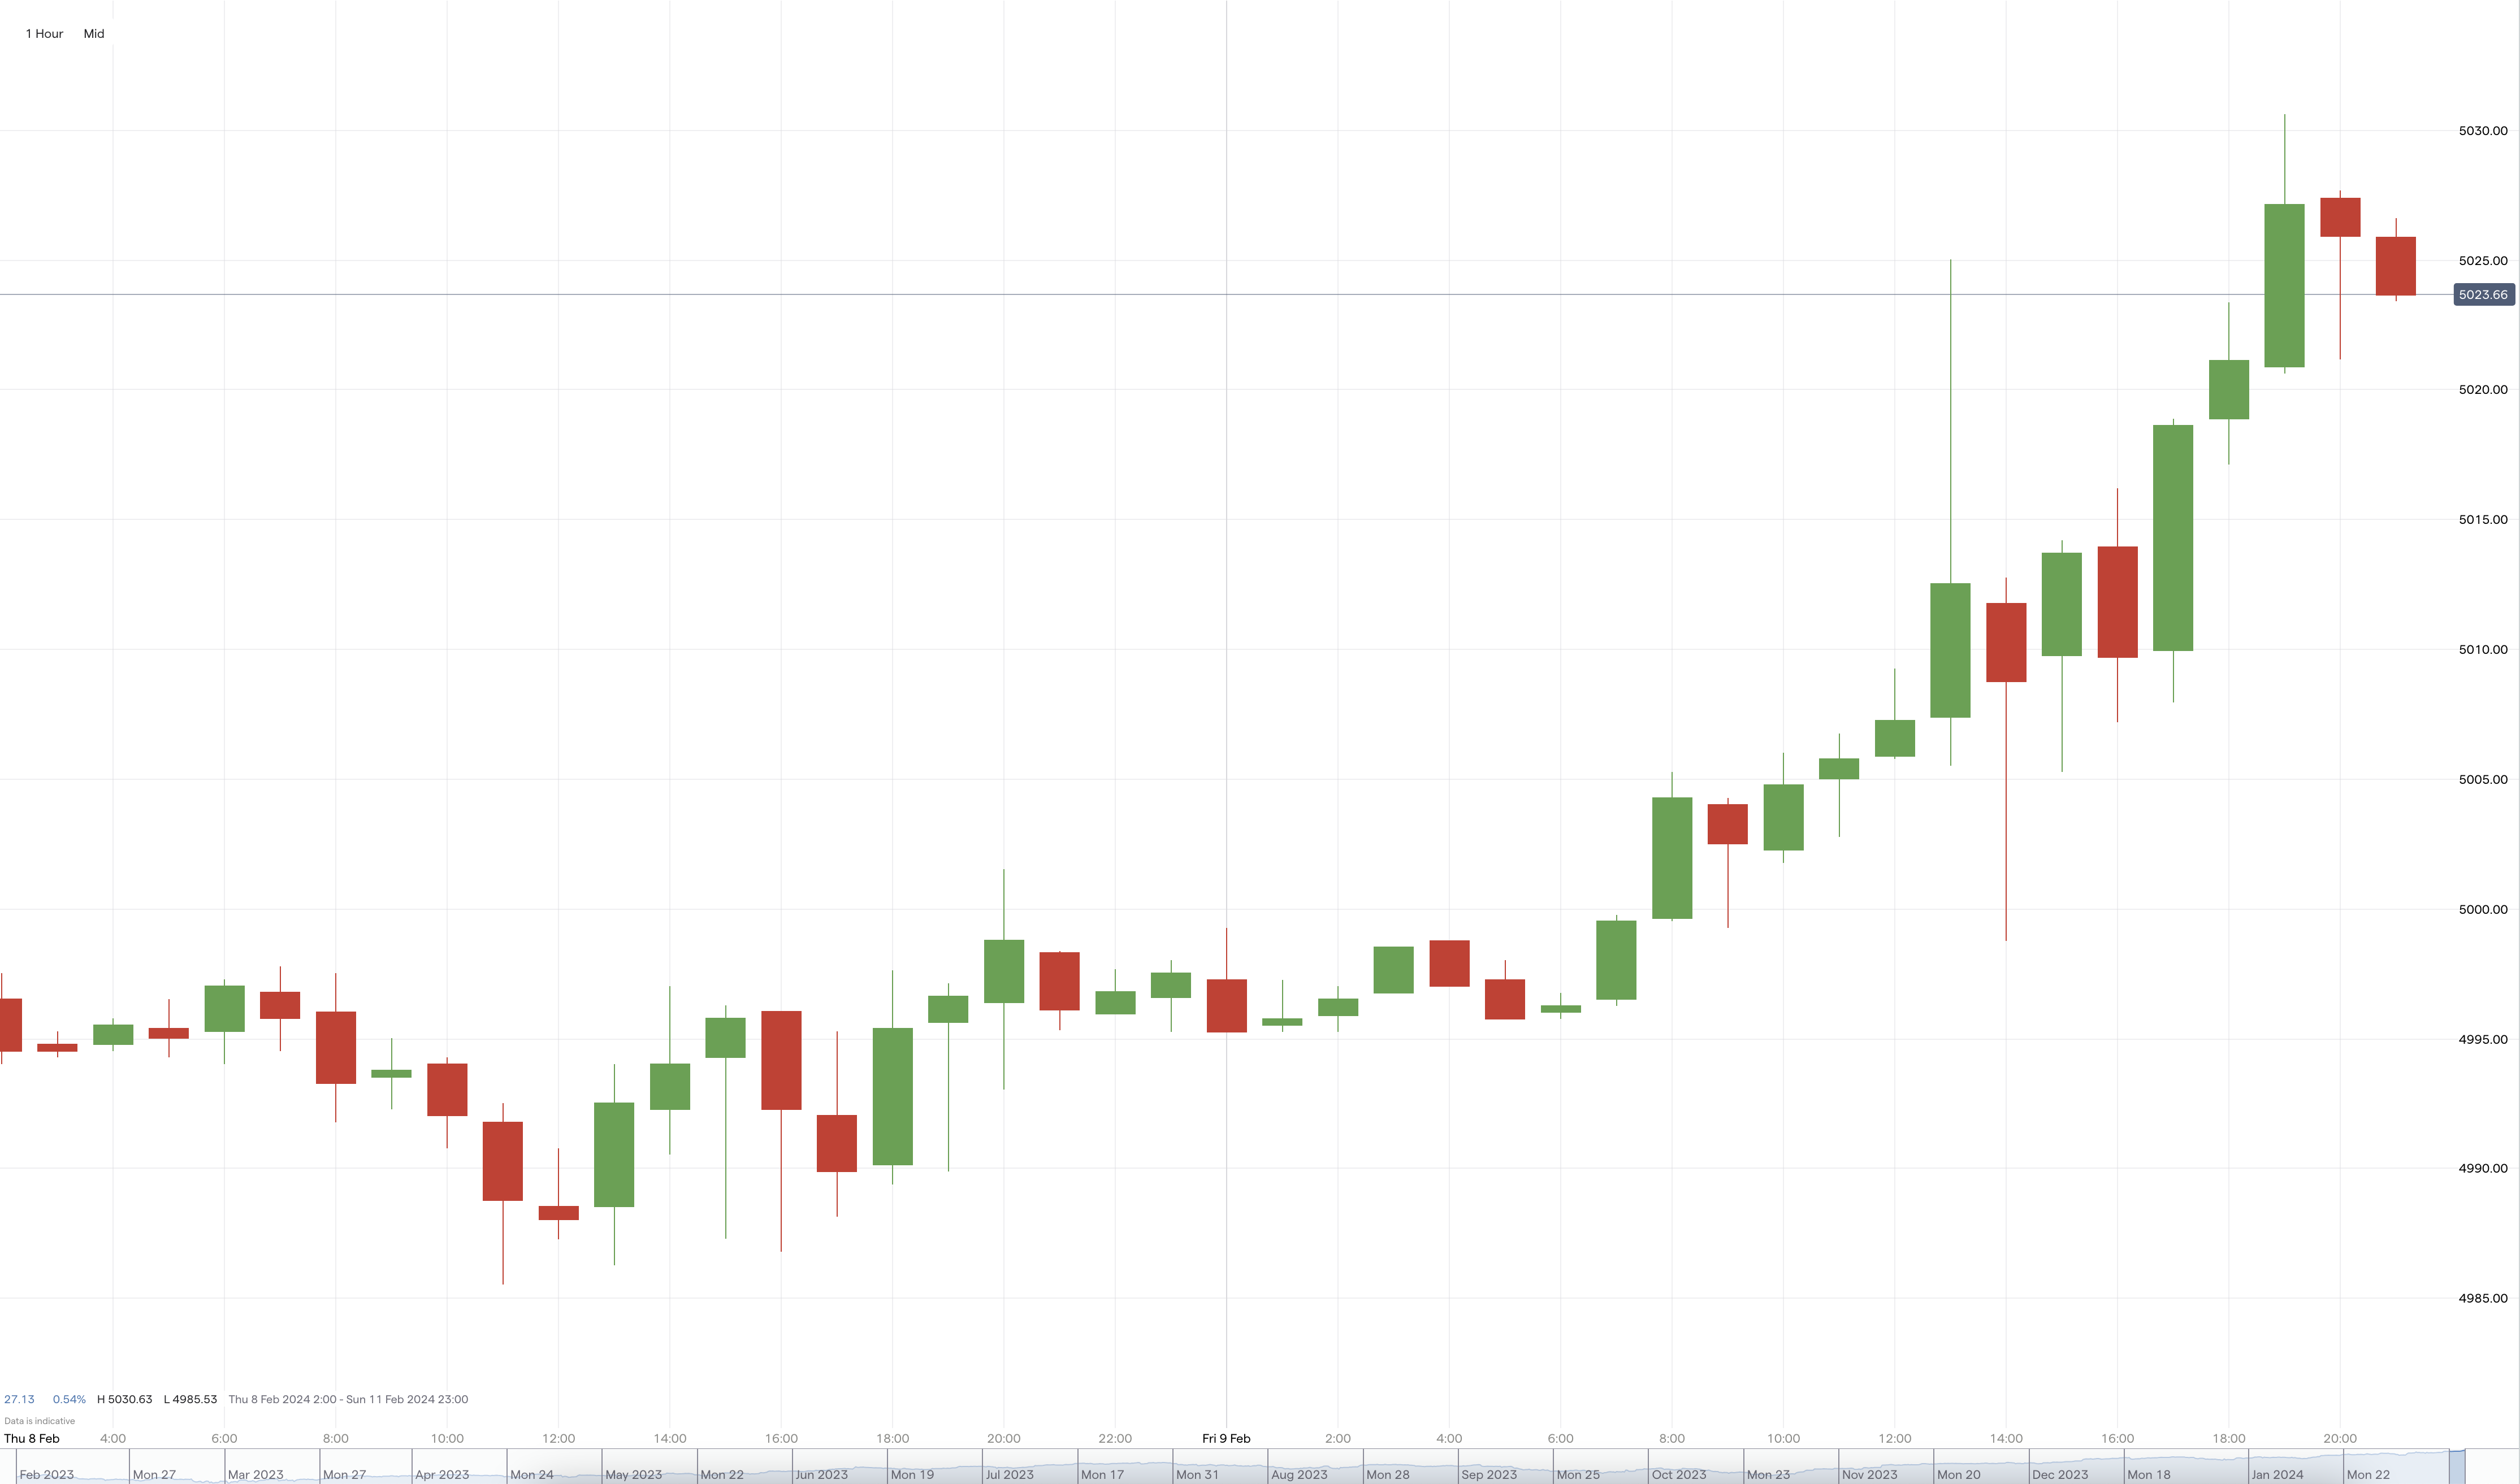
An example of what this looks like is as follows:

What you may notice is that certain patterns emerge with the candle sequence, and these are known as candlestick patterns. There are trading strategies based on these patterns.
Using S&P 500 from EODHD APIs to demonstrate this
The first step is to retrieve the dataset we need, and we will use the official EODHD API Python library for this. The code below will retrieve 720 hours of data which is 30 days.
import config as cfg
from eodhd import APIClient

api = APIClient(cfg.API_KEY)


def get_ohlc_data():
    df = api.get_historical_data("AAPL.US", "1h", results=(24*30))
    return df


if __name__ == "__main__":
    df = get_ohlc_data()
    print(df)
We can start with a simple candlestick pattern called the hammer or hammer pattern. It is a single-candle bullish reversal pattern that be be spotted at the end of a downtrend. The Open, Close, at the top are approximately at the same price, while there is a long wick that extends lower, twice as big as the short body. For more information on this, I highly recommend the description on Investopedia.
A modified version of the candlestick image above to represent this is as follows:

To summarise, the hammer pattern is a bullish signal and is considered a weak reversal pattern. In other words it suggests that the market may change direction from down to up.
I’ve written some code to identify these candles in our dataset.
import pandas as pd
import config as cfg
from eodhd import APIClient

api = APIClient(cfg.API_KEY)


def candle_hammer(df: pd.DataFrame = None) -> pd.Series:
    """* Candlestick Detected: Hammer ("Weak - Reversal - Bullish Signal - Up"""

    # Fill NaN values with 0
    df = df.fillna(0)

    return (
        ((df["high"] - df["low"]) > 3 * (df["open"] - df["close"]))
        & (((df["close"] - df["low"]) / (0.001 + df["high"] - df["low"])) > 0.6)
        & (((df["open"] - df["low"]) / (0.001 + df["high"] - df["low"])) > 0.6)
    )


def get_ohlc_data():
    df = api.get_historical_data("AAPL.US", "1h", results=(24*30))
    return df


if __name__ == "__main__":
    df = get_ohlc_data()
    df["hammer"] = candle_hammer(df)
    print(df)
    print(df[df["hammer"] == True])
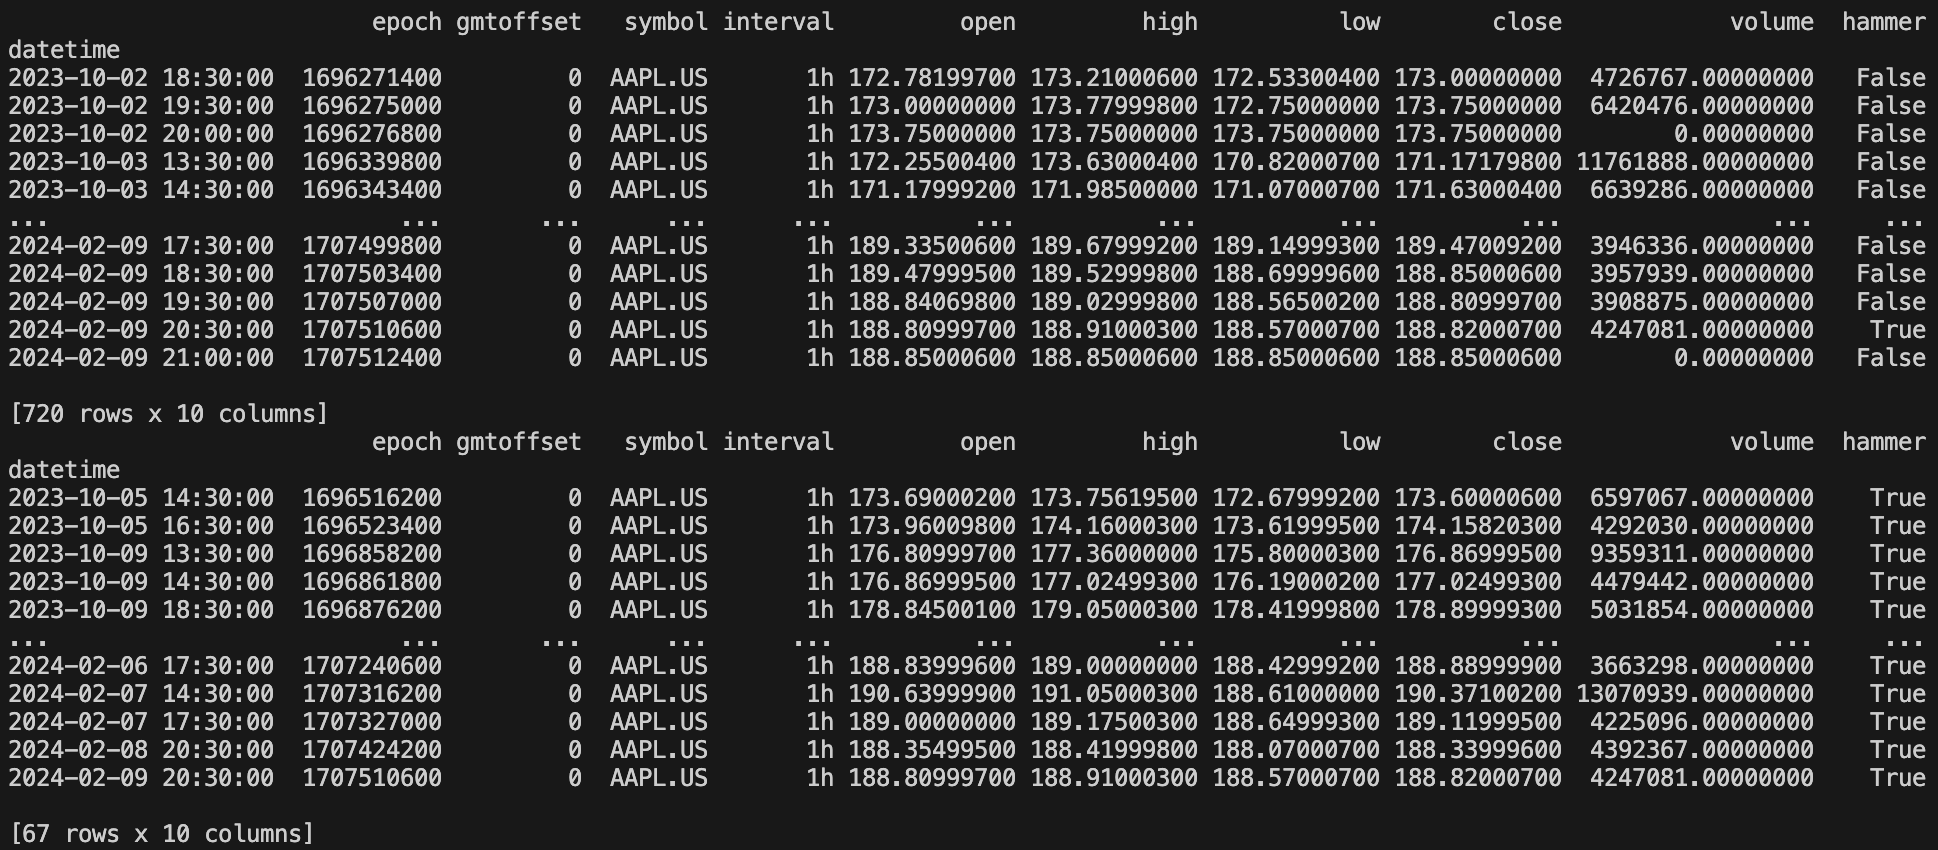
For illustration purposes, I’m printing the dataset twice. The first dataset shows the detection of the hammer candle. The second dataset shows only the rows where the hammer pattern was detected. Over the last 720 hours, the hammer pattern has been detected 67 times.
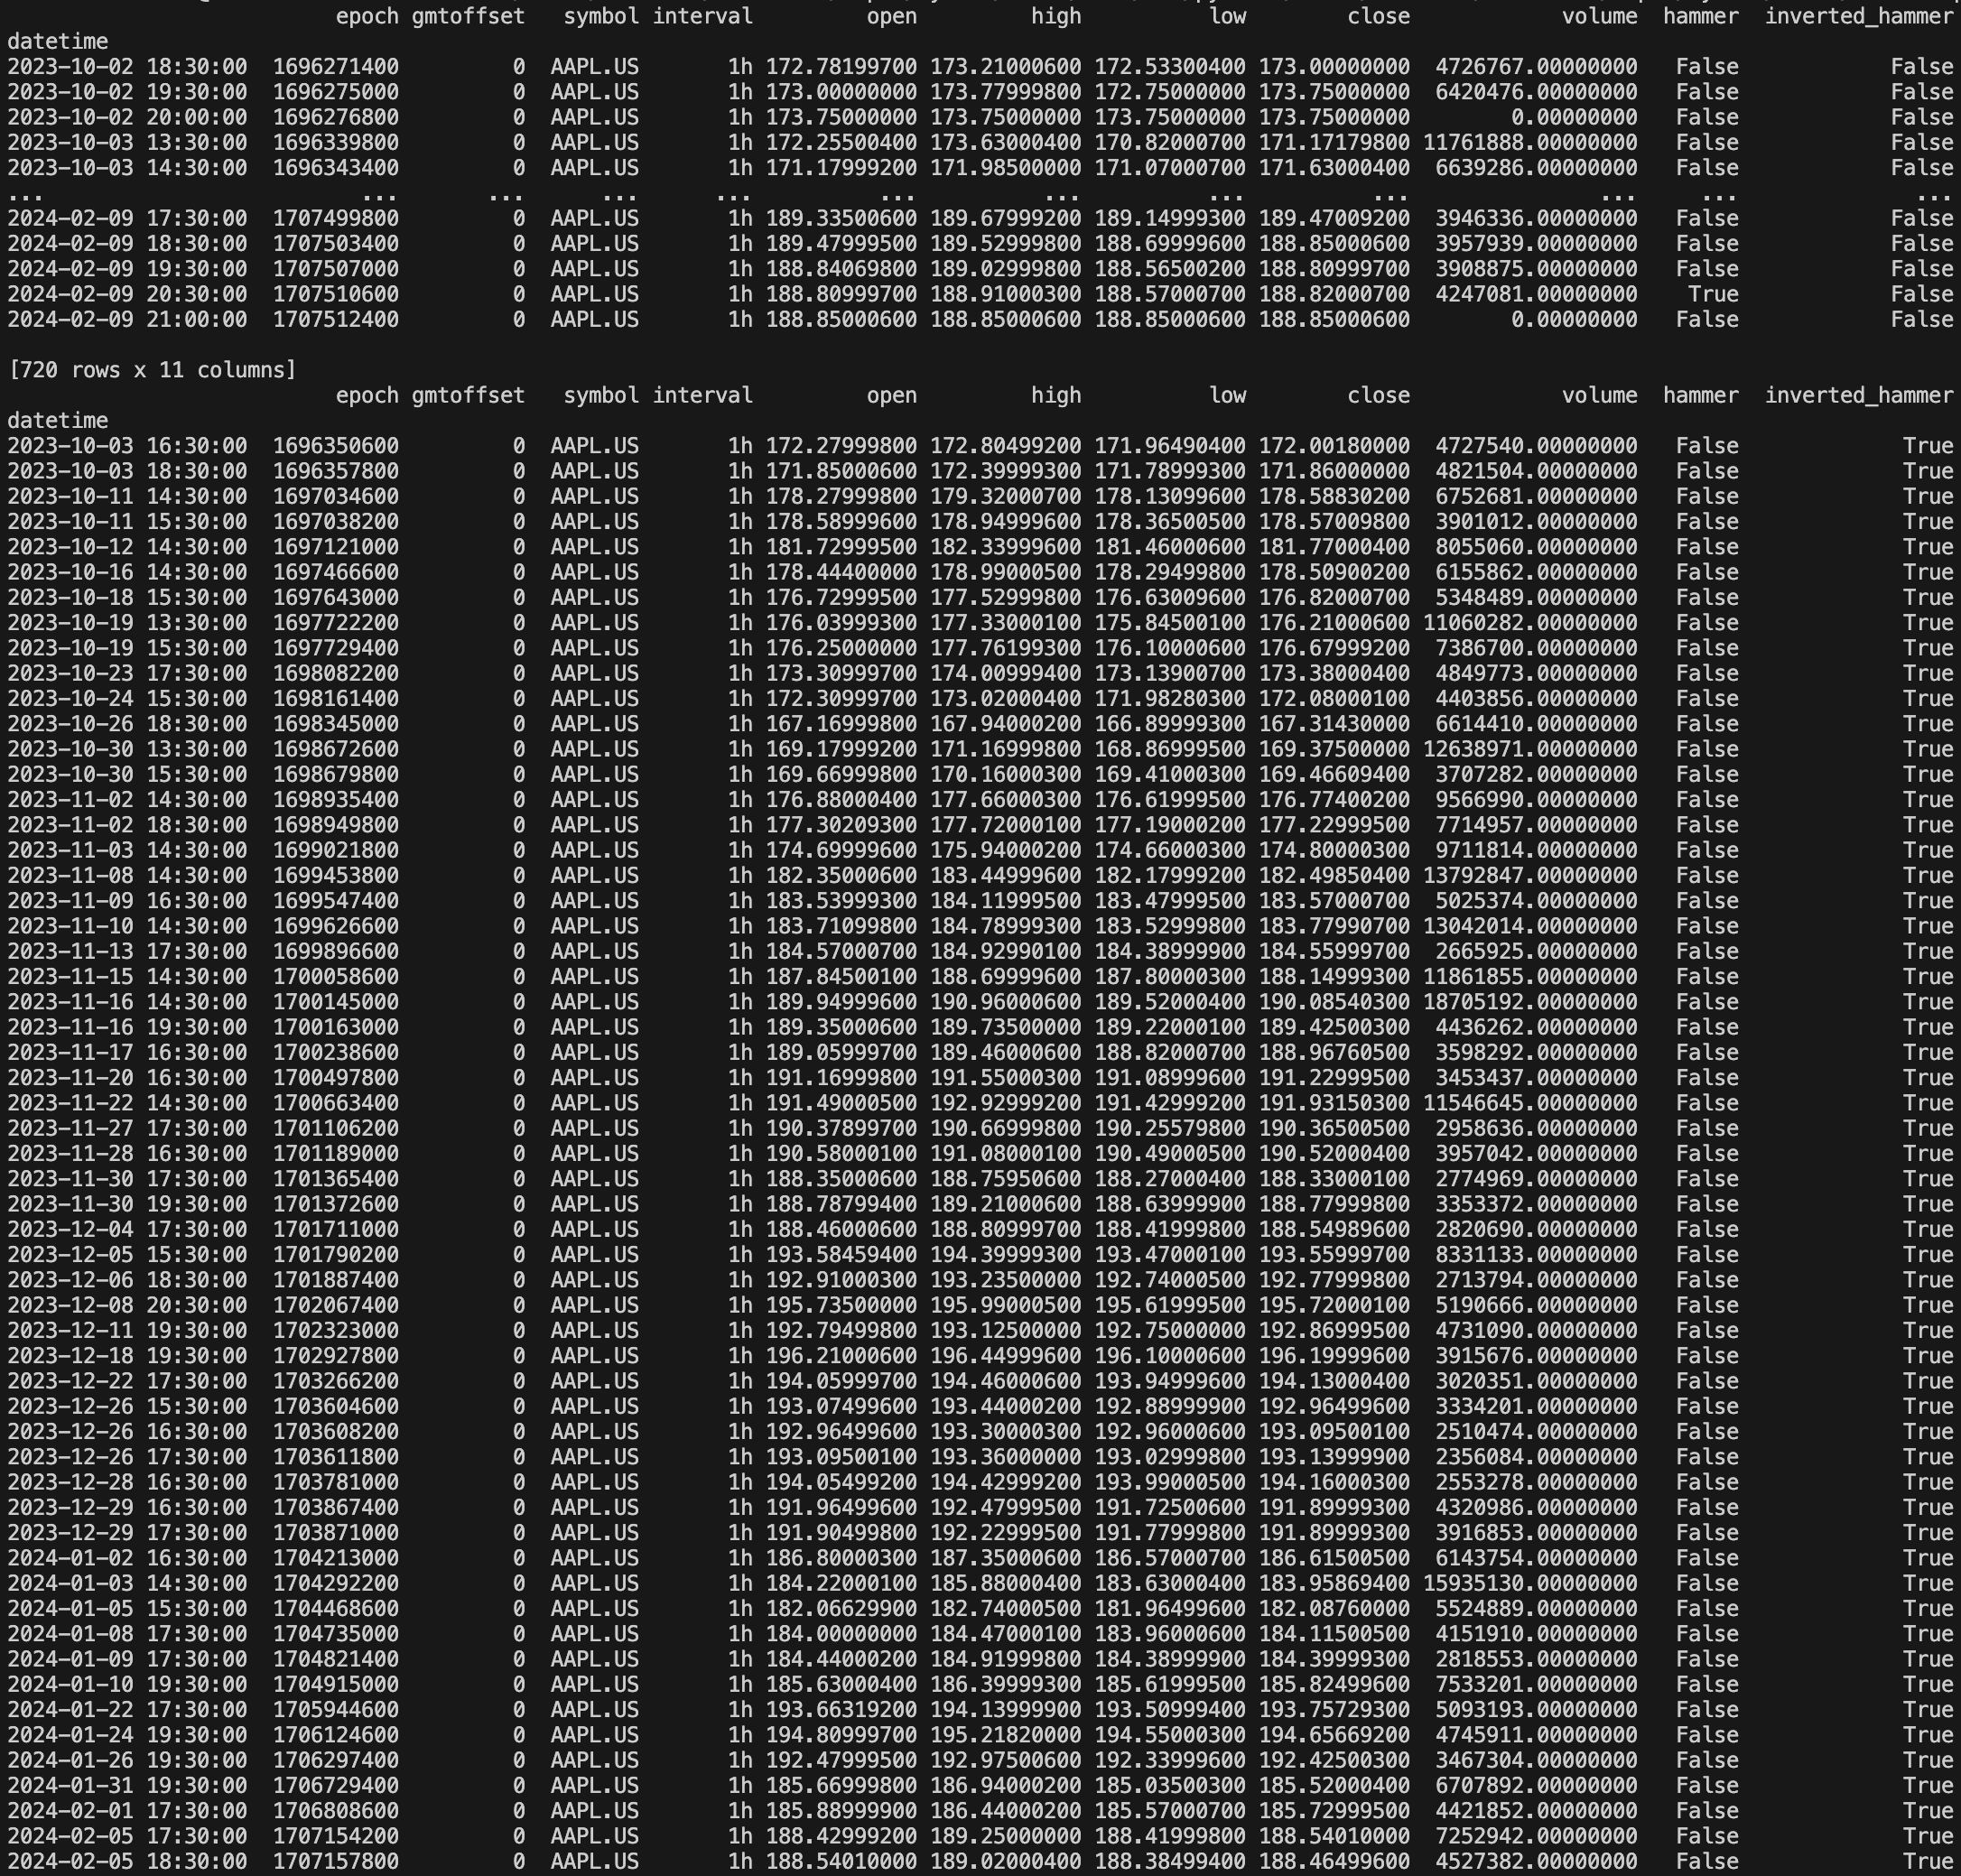
Following on from this there is a closely related candlestick pattern that follows on nicey from this and it is the inverted hammer pattern. It is the opposite of the hammer and looks like hammer standing on its head on the graph. It’s still a bullish candle and will be seen at the bottom of a downtrend.
def candle_inverted_hammer(df: pd.DataFrame = None) -> pd.Series:
    """* Candlestick Detected: Inverted Hammer ("Weak - Continuation - Bullish Pattern - Up")"""

    # Fill NaN values with 0
    df = df.fillna(0)

    return (
        ((df["high"] - df["low"]) > 3 * (df["open"] - df["close"]))
        & ((df["high"] - df["close"]) / (0.001 + df["high"] - df["low"]) > 0.6)
        & ((df["high"] - df["open"]) / (0.001 + df["high"] - df["low"]) > 0.6)
    )
Candlestick Patterns
Candlestick patterns are generally categorised into two groups:
- Bullish or Bearish
- Indecision / Neutral, Weak, Reliable, or Strong
Here is a summary of the common candlestick patterns:
Indecision / Neutral
- Doji
Weak
- Hammer (bullish)
- Inverted Hammer (bearish)
- Shooting Star (bearish)
Reliable
- Hanging Man (bearish)
- Three Line Strike (bullish)
- Two Black Gapping (bearish)
- Abandoned Baby (bullish)
- Morning Doji Star (bullish)
- Evening Doji Star (bearish)
Strong
- Three White Soldiers (bullish)
- Three Black Crows (bearish)
- Morning Star (bullish)
- Evening Star (bearish)
While understanding the trading signals is crucial, the reliability of the data you use is equally important. Learn more:
Free vs Paid Stock Data: Which One Can You Trust?
I’ve translated these candlestick patterns into Python functions. I’ve used Numpy for some of the more complicated candlestick patterns.
import numpy as np

def candle_hammer(df: pd.DataFrame = None) -> pd.Series:
    """* Candlestick Detected: Hammer ("Weak - Reversal - Bullish Signal - Up"""

    # Fill NaN values with 0
    df = df.fillna(0)

    return (
        ((df["high"] - df["low"]) > 3 * (df["open"] - df["close"]))
        & (((df["close"] - df["low"]) / (0.001 + df["high"] - df["low"])) > 0.6)
        & (((df["open"] - df["low"]) / (0.001 + df["high"] - df["low"])) > 0.6)
    )


def candle_inverted_hammer(df: pd.DataFrame = None) -> pd.Series:
    """* Candlestick Detected: Inverted Hammer ("Weak - Reversal - Bullish Pattern - Up")"""

    # Fill NaN values with 0
    df = df.fillna(0)

    return (
        ((df["high"] - df["low"]) > 3 * (df["open"] - df["close"]))
        & ((df["high"] - df["close"]) / (0.001 + df["high"] - df["low"]) > 0.6)
        & ((df["high"] - df["open"]) / (0.001 + df["high"] - df["low"]) > 0.6)
    )


def candle_shooting_star(df: pd.DataFrame = None) -> pd.Series:
    """* Candlestick Detected: Shooting Star ("Weak - Reversal - Bearish Pattern - Down")"""

    # Fill NaN values with 0
    df = df.fillna(0)

    return (
        ((df["open"].shift(1) < df["close"].shift(1)) & (df["close"].shift(1) < df["open"]))
        & (df["high"] - np.maximum(df["open"], df["close"]) >= (abs(df["open"] - df["close"]) * 3))
        & ((np.minimum(df["close"], df["open"]) - df["low"]) <= abs(df["open"] - df["close"]))
    )


def candle_hanging_man(df: pd.DataFrame = None) -> pd.Series:
    """* Candlestick Detected: Hanging Man ("Weak - Reliable - Bearish Pattern - Down")"""

    # Fill NaN values with 0
    df = df.fillna(0)

    return (
        ((df["high"] - df["low"]) > (4 * (df["open"] - df["close"])))
        & (((df["close"] - df["low"]) / (0.001 + df["high"] - df["low"])) >= 0.75)
        & (((df["open"] - df["low"]) / (0.001 + df["high"] - df["low"])) >= 0.75)
        & (df["high"].shift(1) < df["open"])
        & (df["high"].shift(2) < df["open"])
    )


def candle_three_white_soldiers(df: pd.DataFrame = None) -> pd.Series:
    """*** Candlestick Detected: Three White Soldiers ("Strong - Reversal - Bullish Pattern - Up")"""

    # Fill NaN values with 0
    df = df.fillna(0)

    return (
        ((df["open"] > df["open"].shift(1)) & (df["open"] < df["close"].shift(1)))
        & (df["close"] > df["high"].shift(1))
        & (df["high"] - np.maximum(df["open"], df["close"]) < (abs(df["open"] - df["close"])))
        & ((df["open"].shift(1) > df["open"].shift(2)) & (df["open"].shift(1) < df["close"].shift(2)))
        & (df["close"].shift(1) > df["high"].shift(2))
        & (
            df["high"].shift(1) - np.maximum(df["open"].shift(1), df["close"].shift(1))
            < (abs(df["open"].shift(1) - df["close"].shift(1)))
        )
    )


def candle_three_black_crows(df: pd.DataFrame = None) -> pd.Series:
    """* Candlestick Detected: Three Black Crows ("Strong - Reversal - Bearish Pattern - Down")"""

    # Fill NaN values with 0
    df = df.fillna(0)

    return (
        ((df["open"] < df["open"].shift(1)) & (df["open"] > df["close"].shift(1)))
        & (df["close"] < df["low"].shift(1))
        & (df["low"] - np.maximum(df["open"], df["close"]) < (abs(df["open"] - df["close"])))
        & ((df["open"].shift(1) < df["open"].shift(2)) & (df["open"].shift(1) > df["close"].shift(2)))
        & (df["close"].shift(1) < df["low"].shift(2))
        & (
            df["low"].shift(1) - np.maximum(df["open"].shift(1), df["close"].shift(1))
            < (abs(df["open"].shift(1) - df["close"].shift(1)))
        )
    )


def candle_doji(df: pd.DataFrame = None) -> pd.Series:
    """! Candlestick Detected: Doji ("Indecision / Neutral")"""

    # Fill NaN values with 0
    df = df.fillna(0)

    return (
        ((abs(df["close"] - df["open"]) / (df["high"] - df["low"])) < 0.1)
        & ((df["high"] - np.maximum(df["close"], df["open"])) > (3 * abs(df["close"] - df["open"])))
        & ((np.minimum(df["close"], df["open"]) - df["low"]) > (3 * abs(df["close"] - df["open"])))
    )


def candle_three_line_strike(df: pd.DataFrame = None) -> pd.Series:
    """** Candlestick Detected: Three Line Strike ("Reliable - Reversal - Bullish Pattern - Up")"""

    # Fill NaN values with 0
    df = df.fillna(0)

    return (
        ((df["open"].shift(1) < df["open"].shift(2)) & (df["open"].shift(1) > df["close"].shift(2)))
        & (df["close"].shift(1) < df["low"].shift(2))
        & (
            df["low"].shift(1) - np.maximum(df["open"].shift(1), df["close"].shift(1))
            < (abs(df["open"].shift(1) - df["close"].shift(1)))
        )
        & ((df["open"].shift(2) < df["open"].shift(3)) & (df["open"].shift(2) > df["close"].shift(3)))
        & (df["close"].shift(2) < df["low"].shift(3))
        & (
            df["low"].shift(2) - np.maximum(df["open"].shift(2), df["close"].shift(2))
            < (abs(df["open"].shift(2) - df["close"].shift(2)))
        )
        & ((df["open"] < df["low"].shift(1)) & (df["close"] > df["high"].shift(3)))
    )


def candle_two_black_gapping(df: pd.DataFrame = None) -> pd.Series:
    """*** Candlestick Detected: Two Black Gapping ("Reliable - Reversal - Bearish Pattern - Down")"""

    # Fill NaN values with 0
    df = df.fillna(0)

    return (
        ((df["open"] < df["open"].shift(1)) & (df["open"] > df["close"].shift(1)))
        & (df["close"] < df["low"].shift(1))
        & (df["low"] - np.maximum(df["open"], df["close"]) < (abs(df["open"] - df["close"])))
        & (df["high"].shift(1) < df["low"].shift(2))
    )


def candle_morning_star(df: pd.DataFrame = None) -> pd.Series:
    """*** Candlestick Detected: Morning Star ("Strong - Reversal - Bullish Pattern - Up")"""

    # Fill NaN values with 0
    df = df.fillna(0)

    return (
        (np.maximum(df["open"].shift(1), df["close"].shift(1)) < df["close"].shift(2)) & (df["close"].shift(2) < df["open"].shift(2))
    ) & ((df["close"] > df["open"]) & (df["open"] > np.maximum(df["open"].shift(1), df["close"].shift(1))))


def candle_evening_star(df: pd.DataFrame = None) -> np.ndarray:
    """*** Candlestick Detected: Evening Star ("Strong - Reversal - Bearish Pattern - Down")"""

    # Fill NaN values with 0
    df = df.fillna(0)

    return (
        (np.minimum(df["open"].shift(1), df["close"].shift(1)) > df["close"].shift(2)) & (df["close"].shift(2) > df["open"].shift(2))
    ) & ((df["close"] < df["open"]) & (df["open"] < np.minimum(df["open"].shift(1), df["close"].shift(1))))


def candle_abandoned_baby(df: pd.DataFrame = None) -> pd.Series:
    """** Candlestick Detected: Abandoned Baby ("Reliable - Reversal - Bullish Pattern - Up")"""

    # Fill NaN values with 0
    df = df.fillna(0)

    return (
        (df["open"] < df["close"])
        & (df["high"].shift(1) < df["low"])
        & (df["open"].shift(2) > df["close"].shift(2))
        & (df["high"].shift(1) < df["low"].shift(2))
    )


def candle_morning_doji_star(df: pd.DataFrame = None) -> pd.Series:
    """** Candlestick Detected: Morning Doji Star ("Reliable - Reversal - Bullish Pattern - Up")"""

    # Fill NaN values with 0
    df = df.fillna(0)

    return (df["close"].shift(2) < df["open"].shift(2)) & (
        abs(df["close"].shift(2) - df["open"].shift(2)) / (df["high"].shift(2) - df["low"].shift(2)) >= 0.7
    ) & (abs(df["close"].shift(1) - df["open"].shift(1)) / (df["high"].shift(1) - df["low"].shift(1)) < 0.1) & (
        df["close"] > df["open"]
    ) & (
        abs(df["close"] - df["open"]) / (df["high"] - df["low"]) >= 0.7
    ) & (
        df["close"].shift(2) > df["close"].shift(1)
    ) & (
        df["close"].shift(2) > df["open"].shift(1)
    ) & (
        df["close"].shift(1) < df["open"]
    ) & (
        df["open"].shift(1) < df["open"]
    ) & (
        df["close"] > df["close"].shift(2)
    ) & (
        (df["high"].shift(1) - np.maximum(df["close"].shift(1), df["open"].shift(1)))
        > (3 * abs(df["close"].shift(1) - df["open"].shift(1)))
    ) & (
        np.minimum(df["close"].shift(1), df["open"].shift(1)) - df["low"].shift(1)
    ) > (
        3 * abs(df["close"].shift(1) - df["open"].shift(1))
    )


def candle_evening_doji_star(df: pd.DataFrame = None) -> pd.Series:
    """** Candlestick Detected: Evening Doji Star ("Reliable - Reversal - Bearish Pattern - Down")"""

    # Fill NaN values with 0
    df = df.fillna(0)

    return (df["close"].shift(2) > df["open"].shift(2)) & (
        abs(df["close"].shift(2) - df["open"].shift(2)) / (df["high"].shift(2) - df["low"].shift(2)) >= 0.7
    ) & (abs(df["close"].shift(1) - df["open"].shift(1)) / (df["high"].shift(1) - df["low"].shift(1)) < 0.1) & (
        df["close"] < df["open"]
    ) & (
        abs(df["close"] - df["open"]) / (df["high"] - df["low"]) >= 0.7
    ) & (
        df["close"].shift(2) < df["close"].shift(1)
    ) & (
        df["close"].shift(2) < df["open"].shift(1)
    ) & (
        df["close"].shift(1) > df["open"]
    ) & (
        df["open"].shift(1) > df["open"]
    ) & (
        df["close"] < df["close"].shift(2)
    ) & (
        (df["high"].shift(1) - np.maximum(df["close"].shift(1), df["open"].shift(1)))
        > (3 * abs(df["close"].shift(1) - df["open"].shift(1)))
    ) & (
        np.minimum(df["close"].shift(1), df["open"].shift(1)) - df["low"].shift(1)
    ) > (
        3 * abs(df["close"].shift(1) - df["open"].shift(1))
    )
Let’s see if we can find any of the Strong patterns in our dataset…
if __name__ == "__main__":
    df = get_ohlc_data()

    df["three_white_soldiers"] = candle_three_white_soldiers(df)
    df["three_black_crows"] = candle_three_black_crows(df)
    df["morning_star"] = candle_morning_star(df)
    df["evening_star"] = candle_evening_star(df)

    print(df[(df["three_white_soldiers"] == True) | (df["three_black_crows"] == True) | (df["morning_star"] == True) | (df["evening_star"] == True)])
It looks like the Strong patterns have been detected several times over the last 30 days. Based on the data above you can see when a candlestick pattern was detected, and what it was. A challenge for yourself would be to look at an S&P 500 hourly graph at those time intervals and see if you can spot them.
Conclusion
It’s important to remember, however, that no single strategy guarantees success in the markets. The effectiveness of candlestick pattern strategies, like all trading strategies, can be influenced by market conditions, liquidity, and volatility. Therefore, traders should consider these strategies as part of a broader, diversified trading approach, complementing them with other analysis and tools.

