
There is an ocean of strategies existing in the algo trading space, but what’s tough is filtering and choosing the most reliable and profitable ones out of them. In this article, we are going to build one such strategy (a mean-reversion strategy to be specific) that ticks all the boxes of a “good strategy” and backtest it on Python to analyze its results and profitability. We’ll be using EODHD’s stock tick data API accessed via the EODHD python package for effective backtesting. So without further ado, let’s dive into the article!
The Backtesting a Mean-Reversion Strategy Description
Before moving on to the coding part, it’s essential to have a good background about the strategy we are going to build today. The strategy is a mean-reversion trading strategy which means it’s a strategy that relies on the idea that the stock price will return to its average or normal price after a certain point (usually an extreme price movement).
One of the best indicators used for analyzing mean reversions is the Relative Strength Index (RSI) indicator. We’ll be incorporating this indicator along with SMA to create our own custom mean-reversion trading strategy.
We enter the market if: the RSI 10 is lower than 30 and the market is greater than the SMA 200
We exit the market if: the RSI 10 is greater than 70 and the market is below the SMA 200
Though our strategy is barely complex and lies more on the simplistic side, it’s still a highly effective trading strategy. Now, let’s move on to the coding part to see if our strategy proves this point.
Step 1/6: Importing Packages
The first and foremost step in this process of creating a mean-reversion trading strategy is importing the required packages into the Python environment is a non-skippable step. The primary packages are going to be eodhd for extracting historical stock data, Pandas for data formatting and manipulations, and Pandas TA-Lib for calculating technical indicators. The secondary packages are going to be Math for mathematical functions, Datetime for working with dates, and Termcolor for font customization (optional).
# IMPORTING PACKAGES

import pandas as pd
from eodhd import APIClient
import pandas_ta as ta
from datetime import datetime
from termcolor import colored as cl
import math
With the required packages imported into Python, we can proceed to fetch historical data for Tesla using EODHD’s eodhd Python library. Also, if you haven’t installed any of the imported packages, make sure to do so using the pip command in your terminal.
Step 2/6: API Key Activation
The second step in this process of creating a mean-reversion trading strategy is API key activation. It is essential to register the EODHD API key with the package in order to use its functions. If you don’t have an EODHD API key, firstly, head over to their website, then, finish the registration process to create an EODHD account, and finally, navigate to the ‘Settings’ page where you could find your secret EODHD API key. It is important to ensure that this secret API key is not revealed to anyone. You can activate the API key by following this code:
# API KEY ACTIVATION

api_key = '<YOUR API KEY>'
client = APIClient(api_key)
The code is pretty simple. In the first line, we are storing the secret EODHD API key into the api_key and then in the second line, we are using the APIClient class provided by the eodhd package to activate the API key and stored the response in the client variable.
Note that you need to replace <YOUR API KEY> with your secret EODHD API key. Apart from directly storing the API key with text, there are other ways for better security such as utilizing environmental variables, and so on.
Step 3/6: Extracting Historical Data
The third step in this process of creating a mean-reversion trading strategy is extracting the stock data. In this article, we’ll be utilizing the EODHD Stock Tick API which provides granular tick data for all US equities spanning across all exchanges. It includes current and delisted companies, encompassing approximately 80,000 tickers, and 16,000+ securities are updated daily. The total data size is approximately 10 terabytes. The dataset begins from January 1st, 2008, and is updated until the current date. The following code extracts the tick data of Apple via the eodhd package:
# EXTRACTING HISTORICAL DATA

hist_json = client.get_stock_market_tick_data(from_timestamp = '1694354400', to_timestamp = '1694455200', symbol = 'AAPL')
df = pd.DataFrame(hist_json)

df.tail()
The above code uses the get_stock_market_tick_data function provided by the eodhd package to extract the tick data of Apple. The function contains three parameters: from_timestamp – the starting date of the data in UNIX format, to_timestamp – the ending date of the data in UNIX format, and symbol – the ticker of the stock. Here, we are extracting the data from September 10 14.00 to September 11 18.00 and this is the output of the code:
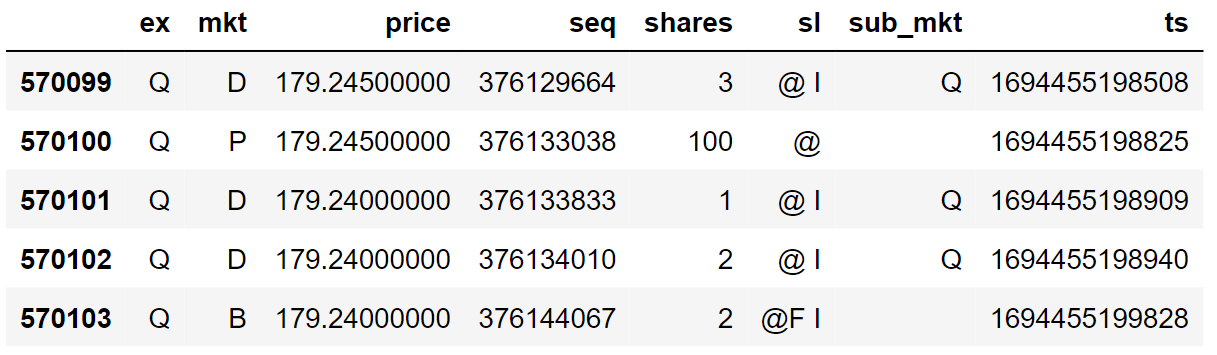
The data contains five columns: ex – the exchange the stock is listed in (Q denotes NASDAQ), mkt – the market where the trade took place, price – the stock price during that transaction, seq – trade sequence number, shares – the number of shares in the transaction, sl – sales condition, sub_mkt – the sub-market where the trade took place, and ts – timestamp.
Step 4/6: Data Wrangling
The fourth step in this process of creating a mean-reversion trading strategy is data wrangling. Data wrangling is the process of processing and manipulating the data to make it even more accessible and usable. Let’s start off by removing the unwanted columns in our dataframe. Apart from the timestamp and stock price, we won’t be requiring any other columns. So let’s remove them.
aapl_df = df[['price', 'ts']]
Next, it can be noticed that the timestamp column is in UNIX format which is usually tough to work with. So let’s change it to the standard date and time format:
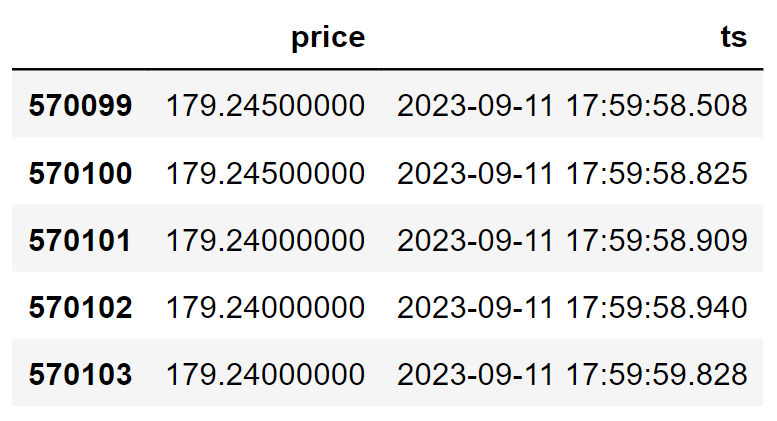
aapl_df.ts = aapl_df.ts.apply(lambda x: x/1000)
aapl_df.ts = aapl_df.ts.apply(lambda x: datetime.utcfromtimestamp(x))
I’m not going to dive deep into this code but the outline is we’re using apply and lambda functions to perform some data manipulations, and on top of that, we are using the datetime package for the conversion. Here’s the final processed dataframe:
Step 5/6: RSI & SMA Calculation
The fifth step in this process of creating a mean-reversion trading strategy is calculating the technical indicators. In this step, we are going to calculate the necessary indicators to build our trading strategy. We can write the code from scratch to calculate the indicators but it’s a time-intensive process. So we are going to use the Pandas TA-Lib package which automatically calculates the indicators for the given data. The following code calculates the RSI and SMA of Apple stock:
# RSI & SMA CALCULATION
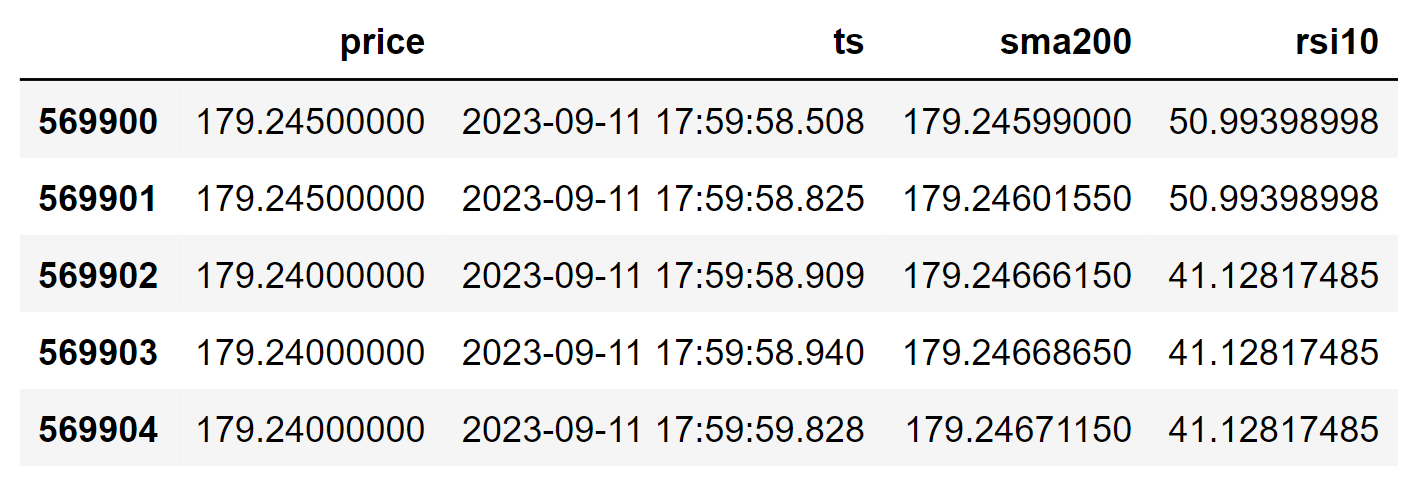
aapl_df['sma200'] = ta.sma(aapl_df.price, length = 200)
aapl_df['rsi10'] = ta.rsi(aapl_df.price, length = 10)
aapl_df = aapl_df.dropna().reset_index().drop('index', axis = 1)
aapl_df.tail()As per the trading strategy we discussed earlier in this article, we are calculating the Relative Strength Index with the lookback period as 10 and the SMA as 200. This is the output of the above code:
Step 6/6: Backtesting the Mean-Reversion Trading Strategy in Python
The sixth and final step in this process of creating a mean-reversion trading strategy is backtesting the strategy. This is the most exciting part of the article where we are going to see if our trading strategy actually works or not. The following code implements our mean-reversion trading strategy and backtests it on the Apple stock tick data we extracted:
# CREATING & BACKTESTING THE STRATEGY

def implement_strategy(aapl_df, investment):

    in_position = False
    equity = investment

    for i in range(3, len(aapl_df)):
        if aapl_df['rsi10'][i] < 30 and aapl_df['price'][i] > aapl_df['sma200'][i] and in_position == False:
            no_of_shares = math.floor(equity/aapl_df.price[i])
            equity -= (no_of_shares * aapl_df.price[i])
            in_position = True
            print(cl('BUY: ', color = 'green', attrs = ['bold']), f'{no_of_shares} Shares are bought at ${aapl_df.price[i]} on {aapl_df.ts[i]}')
        elif aapl_df['rsi10'][i] > 70 and aapl_df['price'][i] < aapl_df['sma200'][i] and in_position == True:
            equity += (no_of_shares * aapl_df.price[i])
            in_position = False
            print(cl('SELL: ', color = 'red', attrs = ['bold']), f'{no_of_shares} Shares are bought at ${aapl_df.price[i]} on {aapl_df.ts[i]}')
    if in_position == True:
        equity += (no_of_shares * aapl_df.price[i])
        print(cl(f'\nClosing position at {aapl_df.price[i]} on {aapl_df.ts[i]}', attrs = ['bold']))
        in_position = False

    earning = round(equity - investment, 2)
    roi = round(earning / investment * 100, 2)
    print('')
    print(cl(f'EARNING: ${earning} ; ROI: {roi}%', attrs = ['bold']))

implement_strategy(aapl_df, 100000)
This code is heavily inspired by the backtesting code written by Yong Hong Tan in his article about the SuperTrend indicator. A shoutout to him for this amazing code. The backtesting results are pretty interesting. The strategy generated tons and tons of trades, even within a millisecond time interval between the trades. This can be an indication that our strategy might be generating false signals. But leaving that aside, here’s the result of the backtesting process:

It looks like our strategy managed to attain a positive ROI of 3.39% in a day which is not bad at all. This is great news.
Conclusion
In this article, we learned to construct a very simple yet effective mean-reversion trading strategy. We backtested the strategy on Apple’s stock tick data extracted using EODHD’s stock tick data API.
Though we went through an extensive process of coding, there is still a lot of scope for improvements. For example, as we discussed before, the strategy generated a lot of false trading signals which can be very dangerous in the real world. So we need to fine-tune the strategy parameters and maybe tweak some logic before deploying it into the real-world. To make the backtesting results more reliable, transaction costs can be mounted for each trade the program executes. Then, several risk management approaches can be deployed to ensure a safe method of trading. These are some ways to improve the overall framework and there are many more to be explored.
With that said, you’ve reached the end of the article. Hope you learned something new and useful today. Thank you very much for your time. Happy backtesting!