In the dynamic world of finance, following the market trends and managing your investment portfolio effectively is crucial for achieving your financial goals. Excel, with its versatile data analysis and manipulation capabilities, serves as a powerful tool for investors. However, manually tracking stock prices and calculating portfolio performance can be time-consuming. This is where financial data APIs step in, seamlessly integrating real-time market data into your Excel spreadsheets, and transforming your investment management experience. You are free to download the Excel template spreadsheet first to navigate the article more easily:
Quick jump:
- 1 Excel and Financial Data APIs Stock Portfolio Spreadsheet Implementation
- 2 Why Use Financial Data APIs with Excel stock portfolio?
- 3 Design Your Spreadsheet
- 4 Connect to the API
- 5 Working with API requests
- 6 Getting Live Stock Prices
- 7 Plot Stock Performance Using Historical Data
- 8 Fundamental Data
- 9 Calculate Portfolio Performance
- 10 Automate Data Updates
- 11 Benefits of Using Financial Data APIs with Excel
- 12 Conclusion
Excel and Financial Data APIs Stock Portfolio Spreadsheet Implementation
For the ready-to-use Excel spreadsheet solution, you may check our ready-to-use Excel add-in, which could help you to get reliable information directly into your spreadsheet. You are also free to check our article on how to build a similar portfolio in Google Sheets.
It’s important to be aware that external URL requests through the desktop version are not available for macOS users. However, you can still use the web version of Excel.
Why Use Financial Data APIs with Excel stock portfolio?
Financial data APIs, also known as market data APIs, provide programmatic access to a wealth of financial information, including stock prices, company financials, economic indicators, and more. By connecting your Excel spreadsheet to a financial data API, you can automate the process of retrieving and updating market data, ensuring that your portfolio analysis is always based on the latest information.
EODHD provides all the necessary data for your financial analysis. In the article, we will be using a couple of them to give you the basics of working with EODHD APIs and integrating them into an Excel spreadsheet:
- Live API – to dynamically track today’s change of the stock
- End-of-Day API – to plot stock price performance
- Fundamentals API – to get fundamental ratios
We recommend you register a free account to get free access to some of our APIs: https://eodhd.com/register
To get full access necessary for a proper stock analysis you can subscribe to our packages here: https://eodhd.com/pricing
Design Your Spreadsheet
Set up your Excel spreadsheet to track all the important stuff – stock ticker symbols, purchase dates, prices, quantities, total investment amounts, and portfolio performance metrics. Common columns include “Ticker,” “Company Name,” “Quantity,” “Purchase Price,” “Current Price,” and “Market Value.” You can add additional columns based on your preferences, such as dividend yield, sector, or any other relevant information.
Connect to the API
This is where the magic happens. Use Excel’s Power Query feature to establish a connection to the financial data API. Think of it like building a bridge between your spreadsheet and the API’s data stream.
To create a dynamically updatable spreadsheet we will use Microsoft Excel’s functions which call data using external URL requests. The most commonly used function is ‘=WEBSERVICE()’. We will also have a look at the newly added ‘=TEXTSPLIT()’ which will help us to automatically structure the received data correctly in the table. The ‘=TEXTSPLIT’ function is available only with the Office 360 updated after 2022.
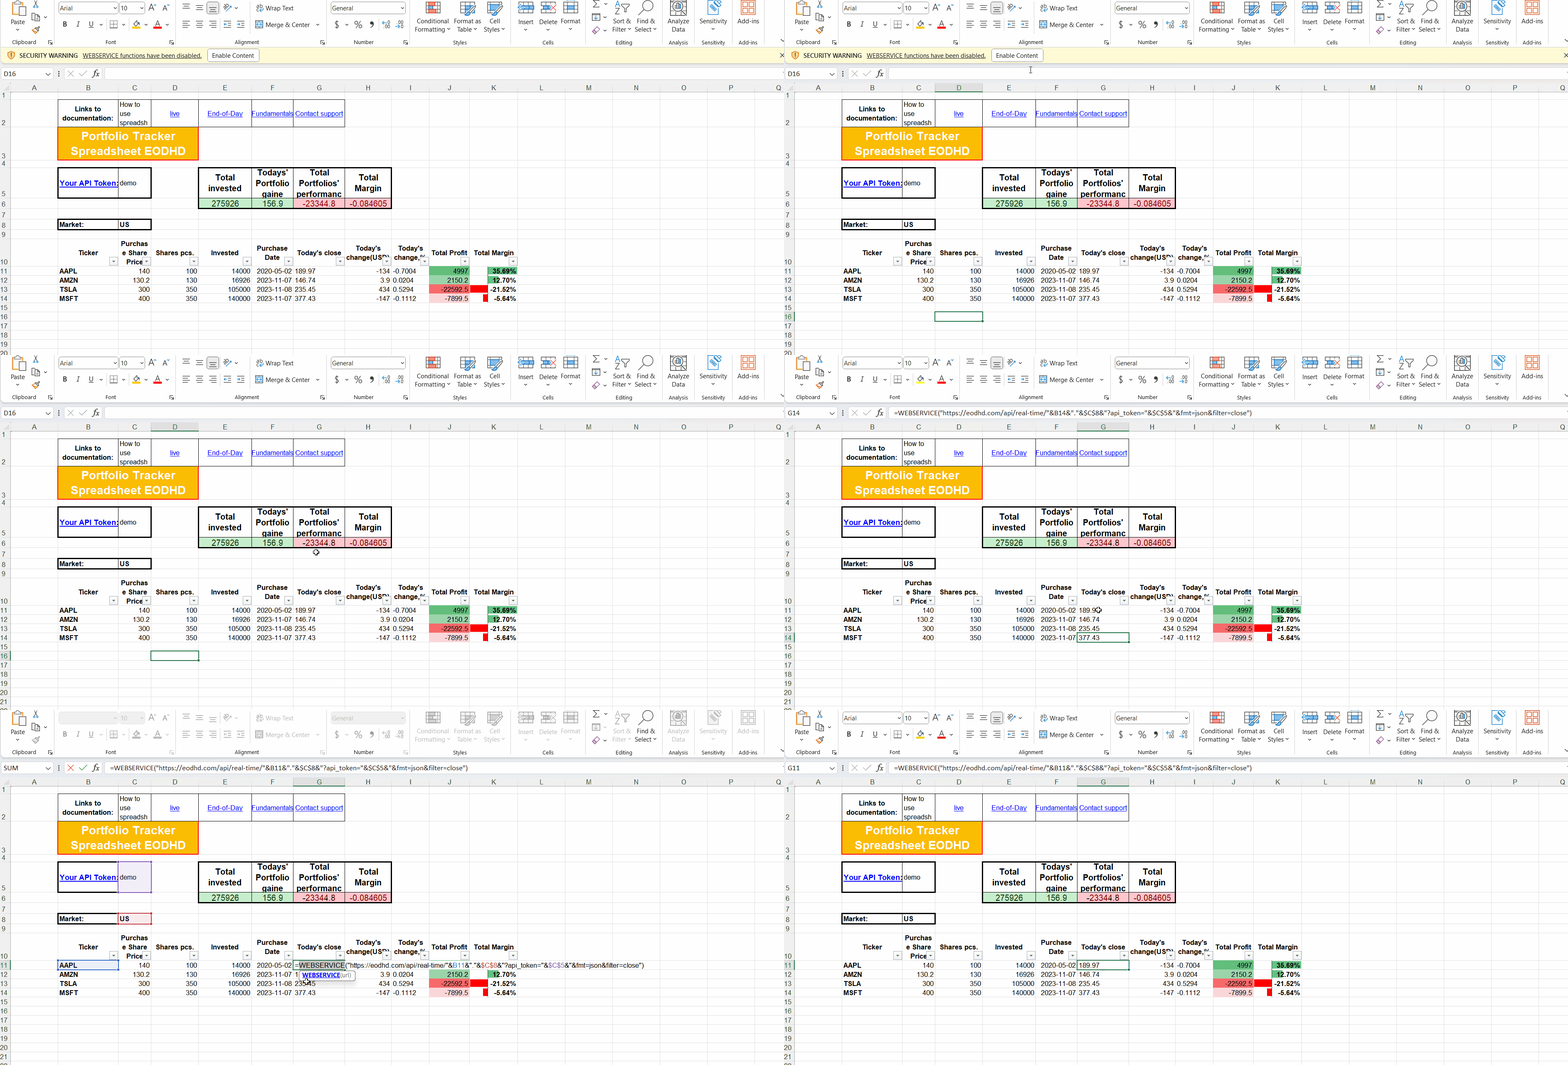
Working with API requests
To get the needed data into your Excel Stock Portfolio spreadsheet efficiently you need to visit a documentation page of the API. There you can understand how requests and received data are structured.
For live API you can open the link and browse the page to find necessary information. It’s important to understand the functionality and potential output of the API to implement it effectively.

Getting Live Stock Prices
Utilize the API’s data retrieval functions to fetch current stock prices for each ticker symbol in your portfolio.
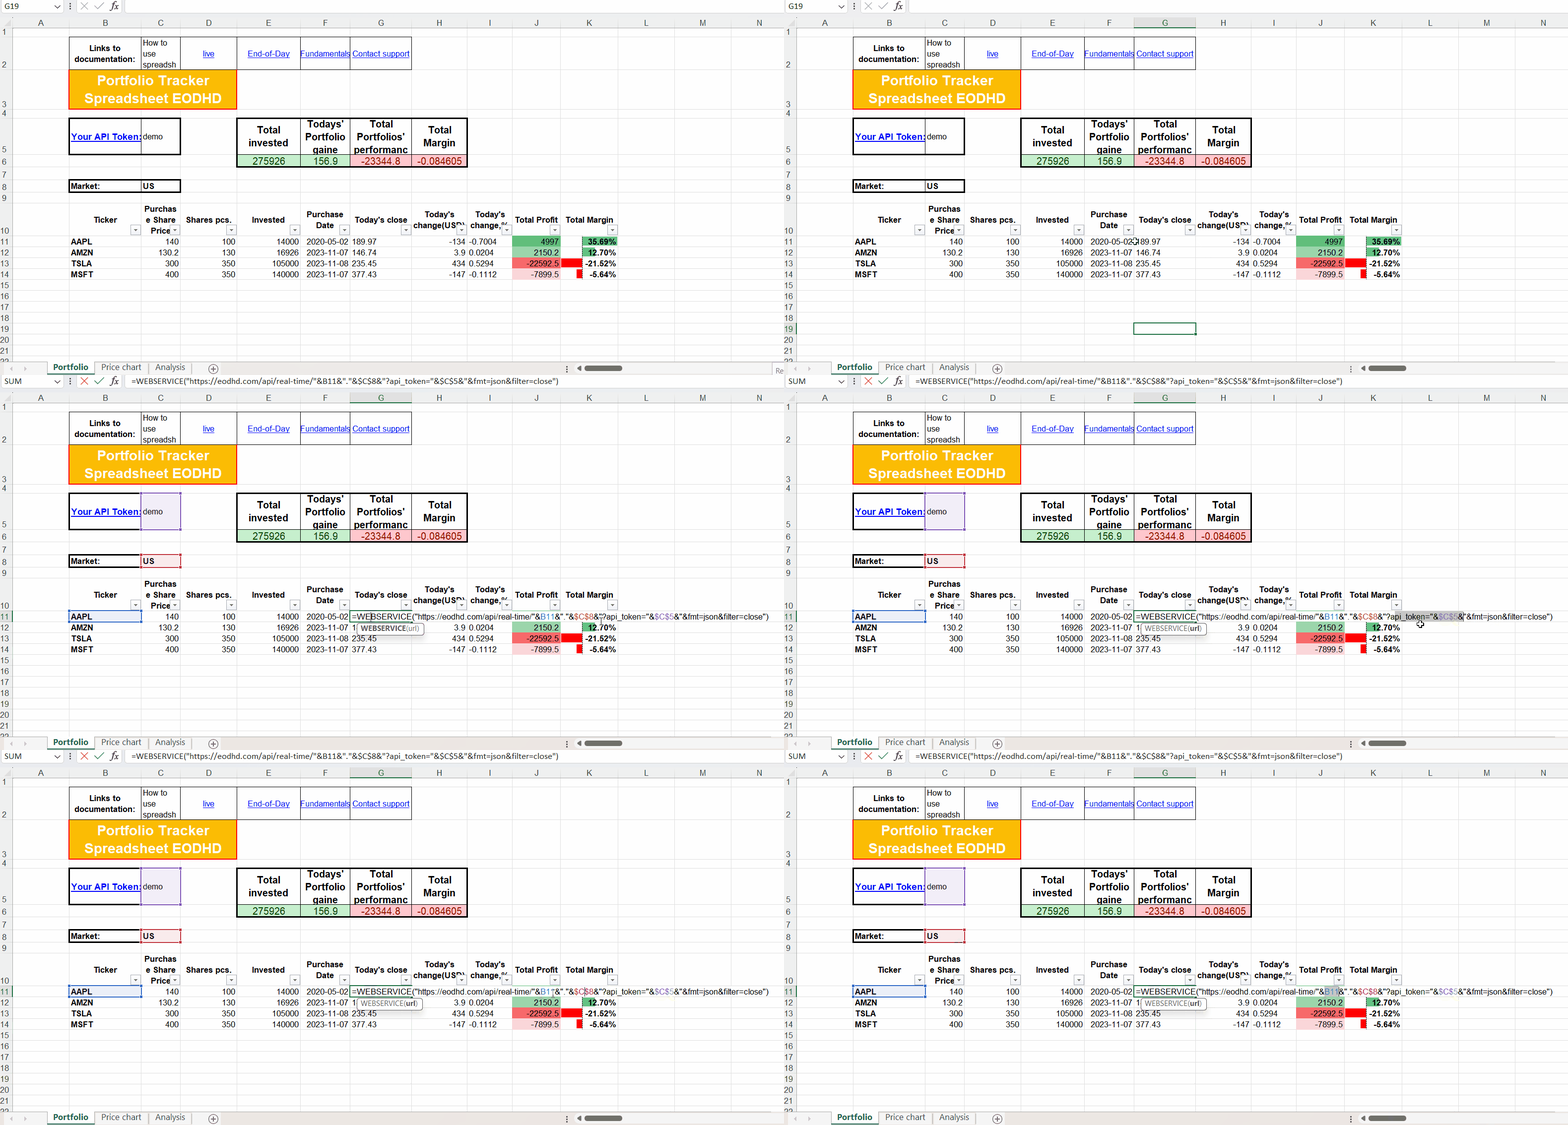
To insert the live data into the cell we will use the following function:
=WEBSERVICE("https://eodhd.com/api/real-time/"&B11&"."&$C$8&"?api_token="&$C$5&"&fmt=json&filter=close")
Note that in the function we use cell values to get ticker (B11), market ($C$8), and API token information ($C$5). The URL itself contains a filter parameter “&filter=close” which will limit the output for the Live API to close price only. ‘&fmt=json’ URL parameter sets output in JSON, for live data we can also choose CSV, however, in this case, we have cleaner data with JSON output. You will find all the filters listed in the live API documentation.
Plot Stock Performance Using Historical Data
Having a price chart always helps to get a better understanding of sporting trends, to get Historical data for the line chart we will use the End-of-Day API. The API provides daily historical data which could be used for stock price analysis.
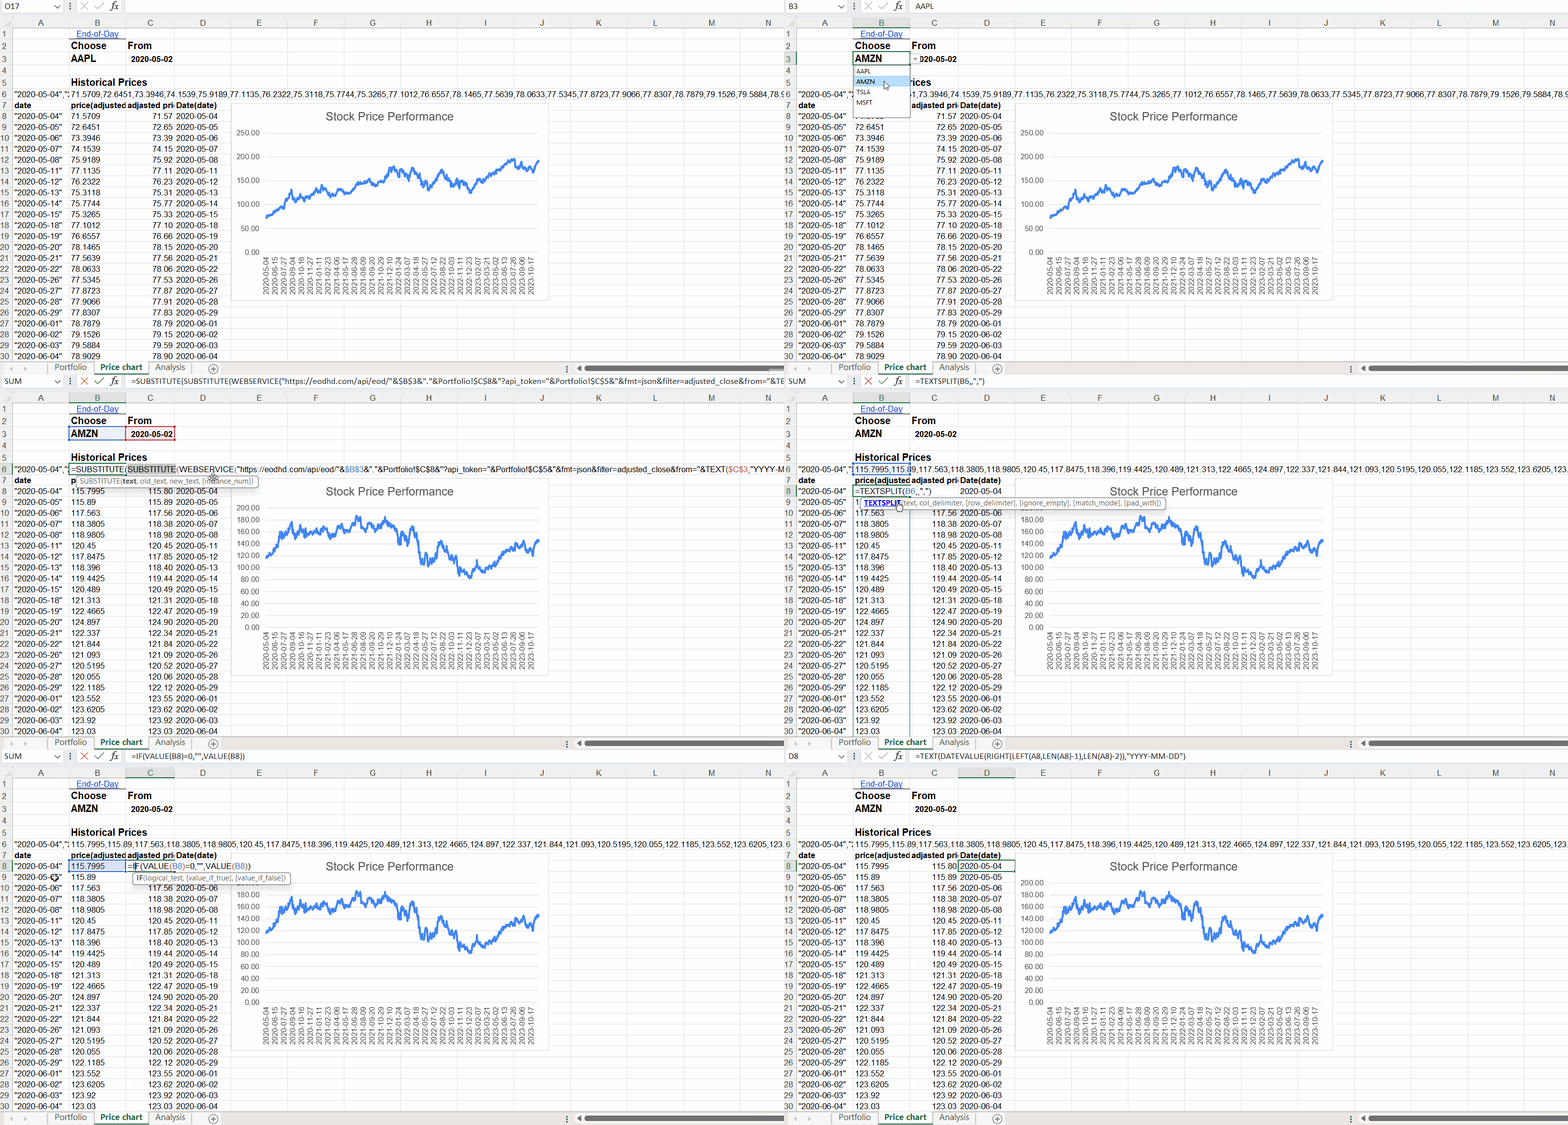
Here price chart is generated on selected stock from your portfolio from the time it was bought.
To insert historical data for the plot into the table we will use the following function:
=SUBSTITUTE(SUBSTITUTE(WEBSERVICE("https://eodhd.com/api/eod/"&$B$3&"."&Portfolio!$C$8&"?api_token="&Portfolio!$C$5&"&fmt=json&filter=adjusted_close&from="&TEXT($C$3,"YYYY-MM-DD")&"&period=d"),"[",""),"]","")
Here we also use cell values for ticker($B$3), market(Portfolio!$C$8&), and API token(Portfolio!$C$5). However, for the price range, we need to get a date from the cell in the proper format for this we use the ‘TEXT($C$3,”YYYY-MM-DD”)’ function. The Microsoft ‘=SUBSTITUTE‘ function is used to delete symbols ‘[…]’ from the start and end of the returned dataset. After getting all the data into one cell we need to modify it to create a table of values, for this, we first use ‘=TEXTSPLIT’:
=TEXTSPLIT(B6,,",")
The formula splits our cell value into tables, however, the data is formatted as text, to transform it to number format we need to use the function ‘=VALUE’ for each cell in a list:
=VALUE(B8)
To get dates for each close price we could use the previous cell formulas with ‘..&filter=date..’, ‘=TEXTSPLIT’ and ‘=DATEVALUE’, similar to price values:
=SUBSTITUTE(SUBSTITUTE(WEBSERVICE("https://eodhd.com/api/eod/"&$B$3&"."&Portfolio!$C$8&"?api_token="&Portfolio!$C$5&"&fmt=json&filter=date&from="&TEXT($C$3,"YYYY-MM-DD")&"&period=d"),"[",""),"]","")
=TEXTSPLIT(A6,,",")
=TEXT(DATEVALUE(RIGHT(LEFT(A8,LEN(A8)-1),LEN(A8)-2)),"YYYY-MM-DD")
For the stock selected, we used the ‘Dropdown‘ menu from the range, and for the automatically updated date used ‘=VLOOKUP‘ function.
Fundamental Data
One of the core principles of fundamental investing is the analysis of corporate financial ratios. In the spreadsheet, we are using Fundamental API to get core analytical data for the portfolio’s stocks.
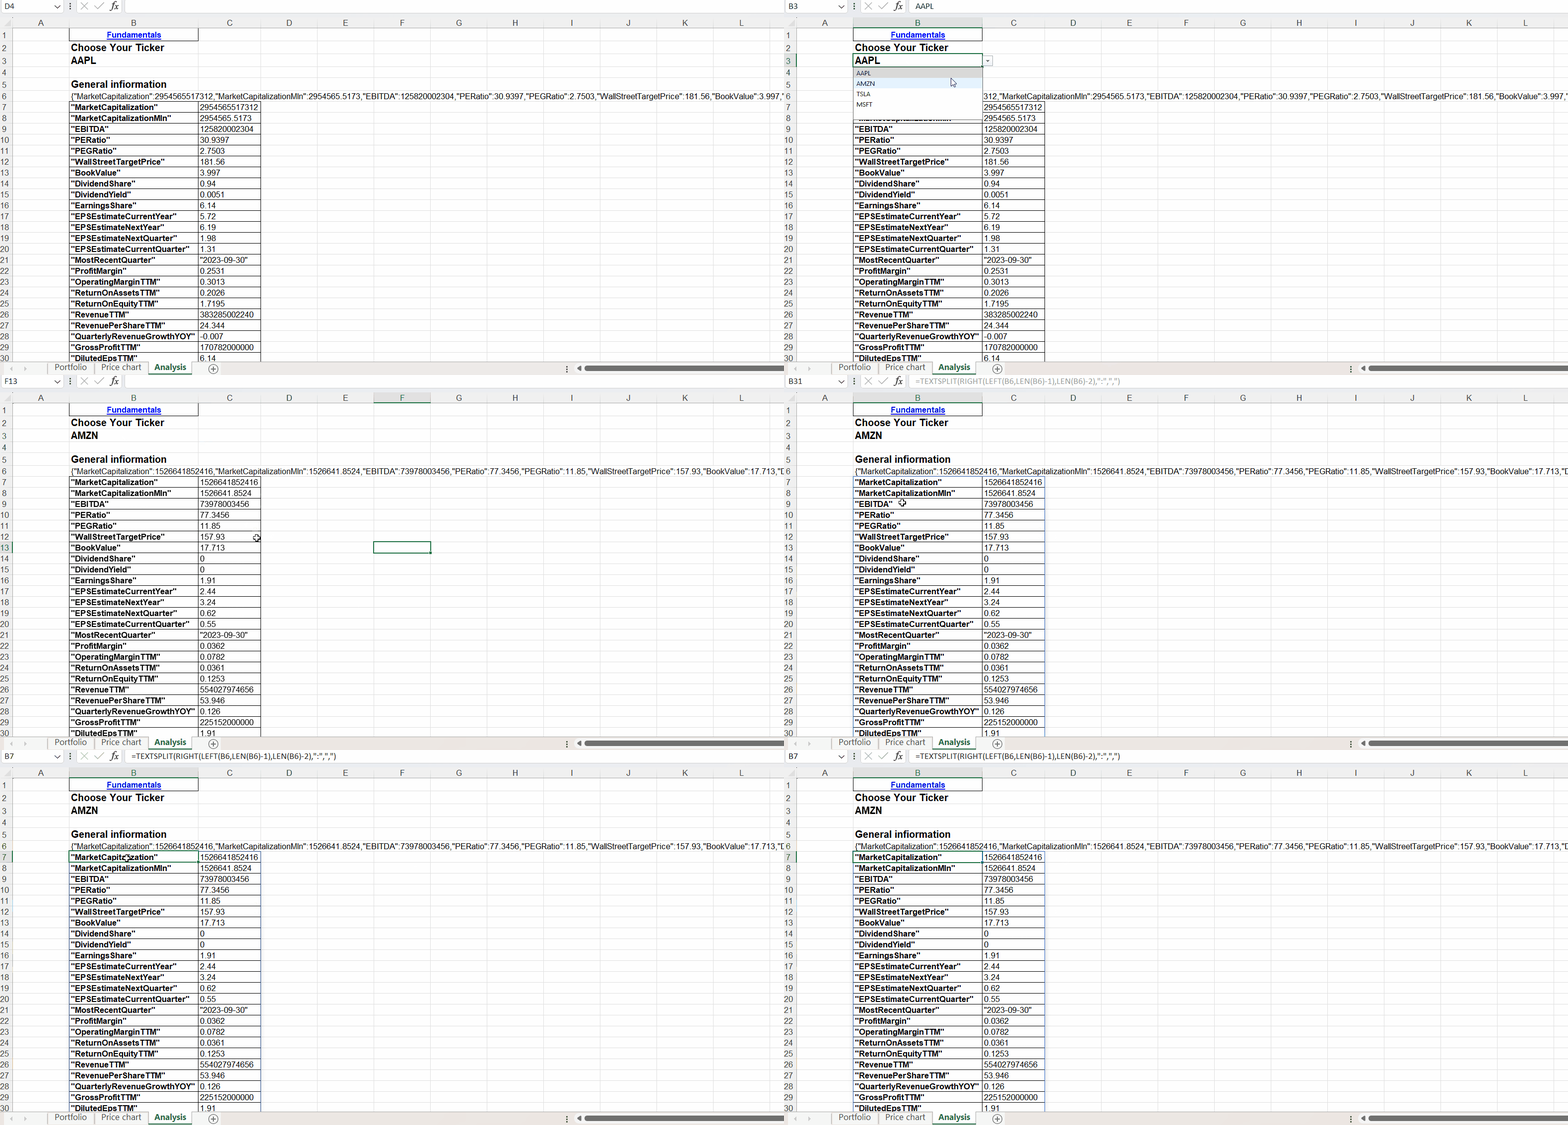
To insert fundamental data into the spreadsheet we will use the following function:
=WEBSERVICE("https://eodhd.com/api/fundamentals/"&$B$3&"."&Portfolio!$C$8&"?api_token="&Portfolio!$C$5&"&filter=Highlights")
As previously we cell values for ticker($B$3), market(Portfolio!$C$8&), and API token(Portfolio!$C$5). We are using only the ‘Highlights’ section of the Fundamental API output with parameter ‘&filter=Highlights’ in the URL request to get only ratios in our spreadsheet. To get the full list
This time we use the ‘=TEXTSPLIT’ function to get data into nice 2x column table, an example of the cell formula is:
=TEXTSPLIT(RIGHT(LEFT(B6,LEN(B6)-1),LEN(B6)-2),":",",")
Calculate Portfolio Performance
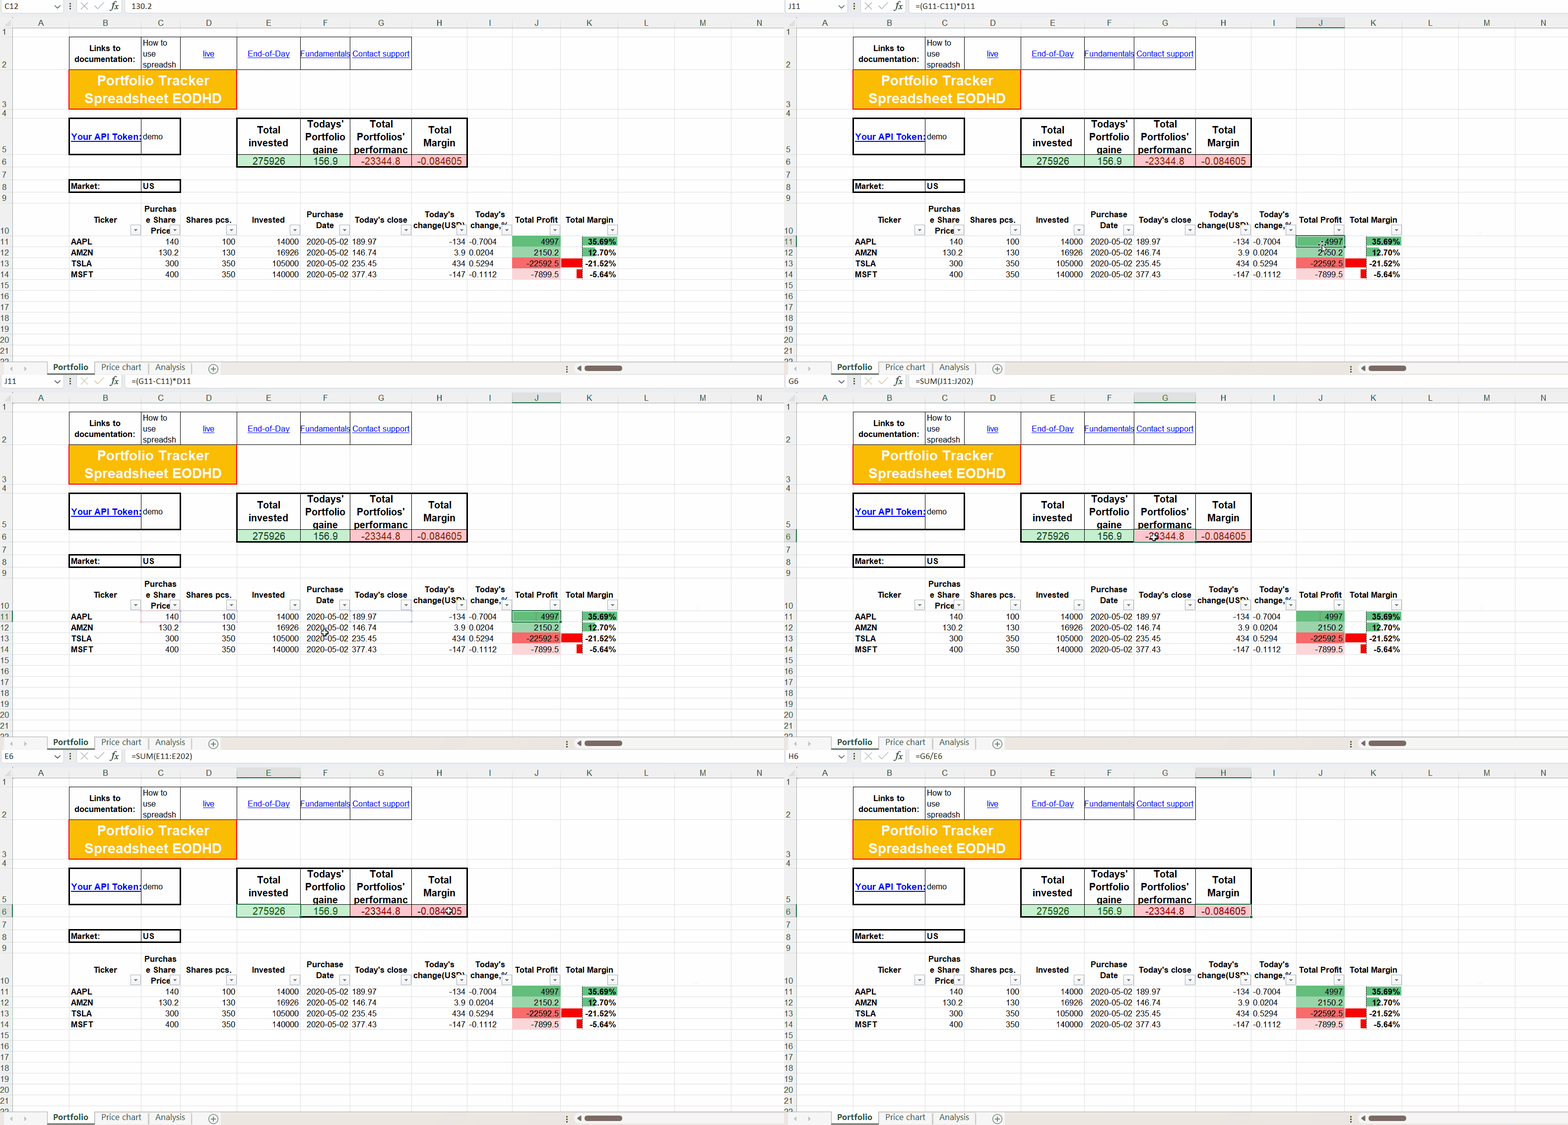
You can Apply Excel algebraic formulas to calculate metrics such as total portfolio value, unrealized gains/losses, and portfolio returns.
Automate Data Updates
Don’t want to manually refresh your data? Schedule regular data updates using Excel’s Data Connection Manager. This keeps your portfolio analysis always up-to-date, even when you’re sleeping.
Benefits of Using Financial Data APIs with Excel
Combining Excel with financial data APIs is like giving your investment management a supercharged boost:
- Real-time Data Access: Get the latest stock prices and market data without manually updating spreadsheets.
- Reduced Errors: No more typos or miscalculations messing up your numbers.
- Enhanced Portfolio Analysis: Gain deeper insights into your portfolio performance with automated calculations.
- Data Customization: Tailor the data retrieved from the API to your specific portfolio needs.
- Scalability: Manage a growing portfolio without the burden of manual data updates.
Conclusion
By leveraging financial data APIs in conjunction with Excel’s powerful data analysis capabilities, you can transform your investment management process, making it more efficient, accurate, and data-driven. Financial data APIs and your own customizable Excel stock portfolio spreadsheet empower you to make informed investment decisions based on real-time market information, enabling you to navigate the dynamic world of finance with confidence.
Feel free to contact support to ask for the current discounts, we would be more than happy to assist and guide you through the process.
