
Google Sheets provides a powerful and flexible platform for building custom dashboards and analysis tools. By creating a Stock Market Dashboard in Google Sheets with the EODHD Financial APIs, you can make a robust dashboard that pulls in real-time historical and current market data into Google Sheets.
This tutorial will walk through importing stock data from EODHD into Google Sheets, setting up functions to fetch live quotes, and visualizing the data through charts and summaries.
You can also check our guides for How to Create Google Sheets Portfolio Tracker and EODHD Google Sheets Add-in. Here you’ll find more information on our Ready-to-Go solutions.
This is a usable Google Sheets example.
Quick jump:
Copy Google Sheets Stock Market Dashboard
To create a new, independent version of the spreadsheet (any changes made to the copied spreadsheet will not affect the original spreadsheet), follow the steps:
- Open the Google Sheets spreadsheet.
- Click “File” in the top menu.
- From the dropdown menu, select “Make a copy”.
- In the “Copy document” dialog box, you can customize the options:
- Enter a name for the copied spreadsheet in the “Name” field.
- Click the “Make a copy” button.
Connect Your Google Sheets to EODHD API
Using the API requires registering and getting your personal API key. However, you can follow the article using the ‘demo’ key for the tickers AAPL, MSFT, TSLA, and MCD.
To start with, you need to make yourself familiar with the basic functionality that the EODHD APIs provide.
The “=IMPORTDATA(URL)” function in Google Sheets allows you to import data from an URL directly into cells. We’ll use this to fetch data from the EODHD API endpoints. The IMPORTDATA function can fetch and parse both CSV and JSON formats into the table. However, the function handles the formats slightly differently, and you need to test which output satisfies your needs.
Examples of EODHD APIs Usage in Google Spreadsheet
In a new Google Sheet, enter the following formula to pull in the list of supported exchanges:
=IMPORTDATA("https://eodhd.com/api/exchanges-list/?api_token=YOUR_API_KEY&fmt=json")
Replace YOUR_API_KEY with your actual EODHD API key. This will populate the sheet with a JSON array of the exchange data. You can change the field “&fmt=json” into “&fmt=csv” to get a CSV output from the API.
To get a stock ticker list for a particular exchange, you can use the “Get Ticker List API” with the exchange code. For the US market, the code is “US”:
=IMPORTDATA("https://eodhd.com/api/exchange-symbol-list/US?api_token=YOUR_API_KEY&fmt=json")
This will return all active stocks and ETFs on the US market in JSON format.
To import historical end-of-day data for stock, use this formula:
=IMPORTDATA("https://eodhd.com/api/eod/AAPL.US?from=2022-01-01&to=2023-01-01&api_token=YOUR_API_KEY&fmt=json")
This will pull the daily open, high, low, close, and volume for Apple (AAPL) between the date range specified. Adjust the ticker, date range, and your API key as needed.
The Live API also provides a live prices endpoint to get delayed quotes. Create a new sheet and enter:
=IMPORTDATA("https://eodhd.com/api/real-time/AAPL.US?api_token=YOUR_API_KEY&fmt=json&filter=close")
This will fetch the current trading price data for Apple Inc. “&filter=close” field helps to get only the close value from the API. To get open/close/volume values, you can delete the filter.
Create a Sparkline Chart in The Cell
Now that you have imported market data into Google Sheets, you can start building your trading dashboard!
To get a sparkline into cell, you need to IMPORTDATA from a historical API (either intraday or EOD) into Google’s SPARKLINE function.
The cell value will look like this:
=SPARKLINE(IMPORTDATA("https://eodhd.com/api/eod/AAPL?api_token=YOUR_API_KEY&fmt=json&filter=adjusted_close&from=2024-01-01"))
This will create a sparkline based on the end-of-day EODHD data for AAPL from the specified date.
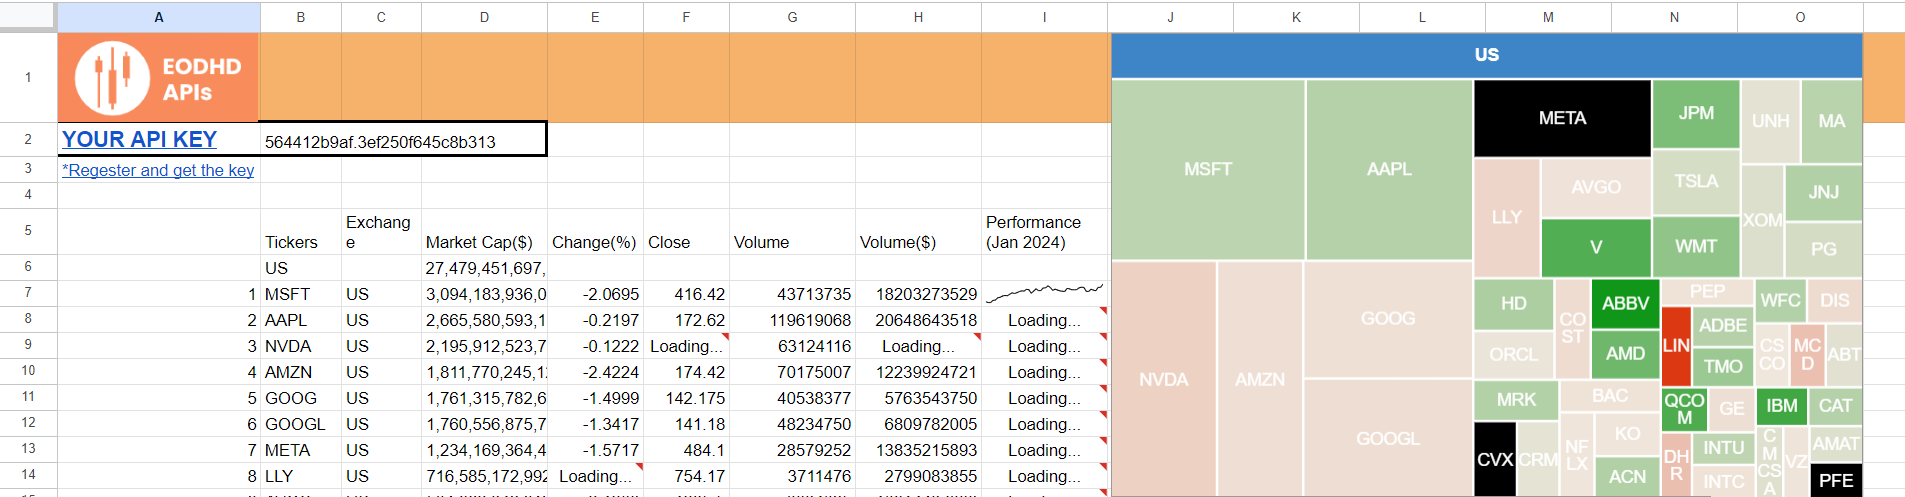
Treemap Market Cap Chart
For a Treemap Chart of a market, you need to structure the data in 4 columns similar to the following table:
| Tickers | Exch | Market Cap($) | Change(%) |
| US | {The sum of components market cap} | ||
| MSFT | US | 3,094,183,936,000.00 | -2.0695 |
| AAPL | US | 2,665,580,593,152.00 | -0.2197 |
| NVDA | US | 2,195,912,523,776.00 | -0.1222 |
| AMZN | US | 1,811,770,245,120.00 | -2.4224 |
The Tickers column will be used to name elements of the chart, Exchange will show to which node value the name belongs, Marketcap will be used for the size of the element, and the Change(%) column for the color. Note that the first line after the header specifies the node and the total sum of the included component weights.
To get market capitalization, you can use the Fundamentals API with the “&filter=Highlights::MarketCapitalization” field:
=IMPORTDATA("https://eodhd.com/api/fundamentals/AAPL?api_token=YOUR_API_TOKEN&fmt=json&filter=Highlights::MarketCapitalization")
The cell formula will fetch the market cap value for AAPL into the selected cell.
For daily changes in price, you can our Live(delayed) API with field “&filter=change_p”
=IMPORTDATA("https://eodhd.com/api/real-time/AAPL.US?api_token=YOUR_API_KEY&fmt=json&filter=change_p")
The formula will provide the current stock price change for the selected cell.
An example of Google Sheets Stock Market Dashboard is shown below.
Leverage EODHD APIs for your Financial results
You can use your ingenuity to create summaries of your portfolio holdings, import news/sentiment data, analyze pricing trends using charts and sparklines, and set up conditional formatting rules to highlight trading signals.
The EODHD API provides a wide range of data endpoints from pricing to fundamentals to corporate events that you can integrate to create a rich, comprehensive trading dashboard.
By leveraging the power of Google Sheets combined with the high-quality data from EODHD, you can deploy a robust, customizable trading analysis tool to aid your investment decisions. Get started today by signing up for an EODHD API key!
Feel free to contact our amazing support to ask for the currently available discounts, we would be more than happy to assist and guide you through the process.