

The Exponential Moving Average (EMA) is one of the most widely used technical indicators in the trading world, yet in most cases, it is not used to its full potential. People are still using generic strategies like the EMA 50 & 200 crossover which is not a bad thing but since it’s overused by a lot of traders, its commonality has deteriorated the strategy’s efficiency. Today, we are going to explore a new EMA crossover strategy and check if it beats the market by outperforming the results of the buy/hold strategy.
But there’s a catch. We’re going to backtest the strategy on delisted stocks. Why? Because the price movements of delisted stocks are more volatile than of listed stocks, giving us an opportunity to test our strategy in all types of market scenarios.
In this article, we will first extract the historical data of delisted stocks using EODHD’s end-of-day data API endpoint, then we’ll extract the EMA data using EODHD’s technical indicator API, and followed by that, we’ll construct the trading strategy and backtest it on a delisted stock. We will also compare the results of our EMA crossover strategy with that of the buy/hold strategy for validation.
With that said, let’s dive into the article!
Quick jump:
The Trading Strategy
Before actually moving on to coding the trading strategy, it’s very essential to gain some background on our EMA crossover trading strategy. Our strategy consists of three EMAs with different lookback periods, and it generates signals based on certain crossover criteria.
The following are the mechanics of our strategy:
- We enter the market if: EMA 10 crosses above EMA 30 and EMA 10 is greater than EMA 50
- We exit the market if: EMA 10 crosses below EMA 30 and EMA 9 is lower than EMA 50
This is a simple yet effective crossover strategy that helps in capturing the direction of the price movements and provides trading signals accordingly.
Now that we have a good background of the trading strategy that we’re going to implement, let’s move on to the coding part to transform this idea into an actual useful strategy.
Importing Packages
The first and foremost step is to import all the required packages into our Python environment. In this article, we’ll be using four packages which are:
- Pandas — for data formatting, clearing, manipulating, and other related purposes
- Matplotlib — for creating charts and different kinds of visualizations
- eodhd — for extracting historical and technical indicator data
- Termcolor — to customize the standard output shown in Jupyter notebook
- Math — for various mathematical functions and operations
The following code imports all the above-mentioned packages into our Python environment:
# IMPORTING PACKAGES

import pandas as pd
from eodhd import APIClient
import math
from termcolor import colored as cl
import matplotlib.pyplot as plt

plt.rcParams['figure.figsize'] = (20,10)
plt.style.use('fivethirtyeight')
If you haven’t installed any of the imported packages, make sure to do so using the pip command in your terminal.
API Key Activation
The second step in this process of using the stock screener API to build custom screeners is API key activation. Screener API is included in two of our plans: All-in-one and EOD+Intraday.
If you don’t have an EODHD API key, head over to our website and finish the registration process to create an EODHD account, and finally, navigate to the ‘Settings’ page where you can find your secret EODHD API key. It is important to ensure that this secret API key is not revealed to anyone.
You can activate the API key by following this code:
# API KEY ACTIVATION

api_key = '<YOUR API KEY>'
client = APIClient(api_key)
The code is pretty simple. In the first line, we are storing the secret EODHD API key in the api_key variable, and then in the second line, we are using the APIClient class provided by the eodhd package to activate the API key and stored the response in the client variable.
Note that you need to replace <YOUR API KEY> with your secret EODHD API key. Apart from directly storing the API key with text, there are other ways for better security such as utilizing environmental variables, and so on.
Getting the list of Delisted Stocks
Now let’s extract the list of available delisted stocks on EODHD. In order to do that, we can utilize the “get_list_of_tickers” function provided by the eodhd package. The following code extracts the list of delisted stocks:
# GETTING LIST OF DELISTED STOCKS

tickers = client.get_list_of_tickers(delisted = 1, code = 'NASDAQ')
tickers_df = pd.DataFrame(tickers)

tickers_df = tickers_df.fillna('None')
tickers_df = tickers_df[tickers_df.Isin != 'None']
tickers_df
The function “get_list_of_tickers” has two parameters. First is “delisted” which is 1 if we want the delisted stocks or 0 if we want listed stocks. The next parameter is “code” where we should specify the exchange we’re interested in.
After extracting the list of tickers, we convert the response into a Pandas dataframe. This is the final output after performing some data manipulations:
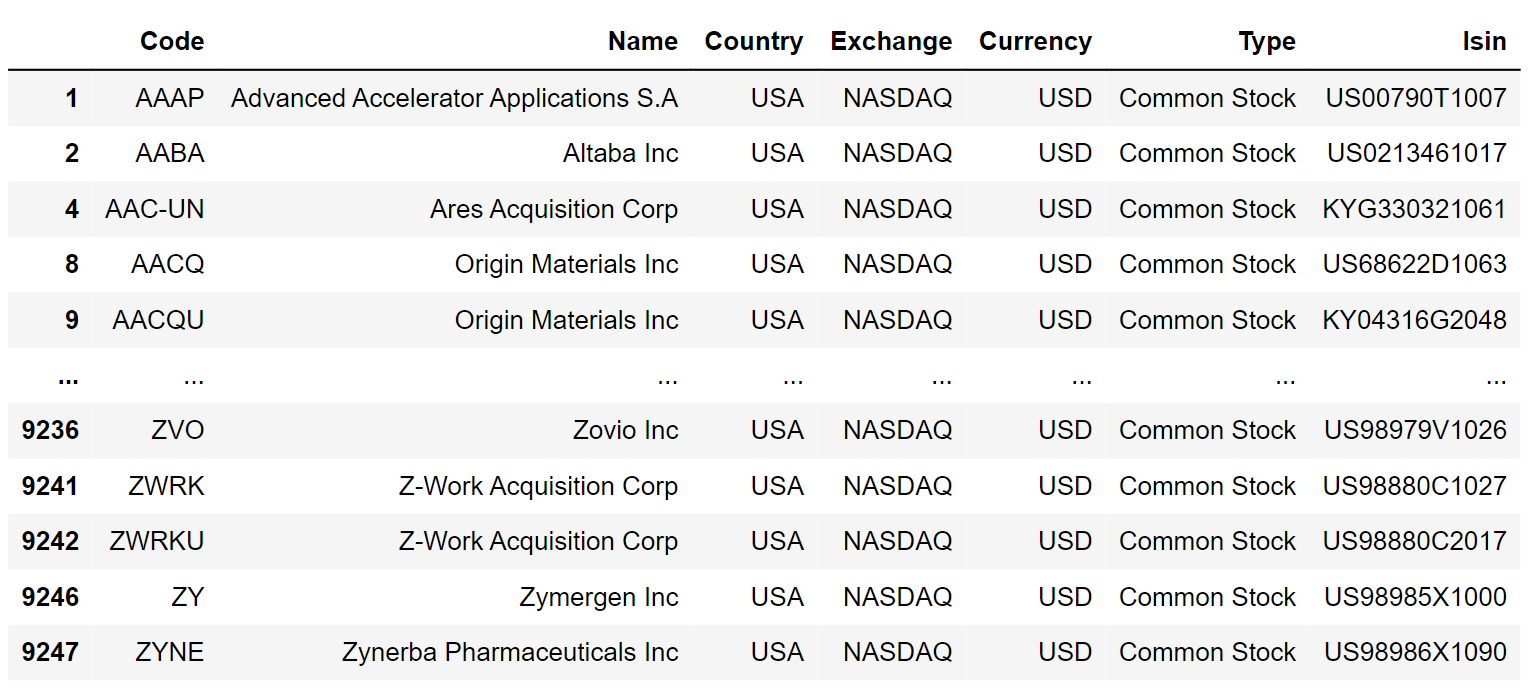
One thing that I truly love about this function is that it not only gives out the list of tickers but also some additional information like the stock’s name, exchange, current, type, etc. which can come really handy in a lot of cases.
Extracting Historical Data
The delisted stock that we’re going to focus on here for backtesting our strategy is AveXis, currently known as Novartis Gene Therapies. It was a biotechnology company based in Dallas, Texas. It was founded in 2012 and acquired by Novartis in 2018. The following code uses EODHD’s end-of-day data API endpoint to extract the historical data of AveXis:
# EXTRACTING HISTORICAL DATA

hist_json = client.get_eod_historical_stock_market_data(symbol = 'AVXS.US', period = 'd')
df = pd.DataFrame(hist_json)
df = df.set_index('date')

df
There is nothing complicated going on with this code. In the first line, we are using the “get_eod_historical_stock_market_data” function provided by the eodhd package to extract the historical data of AveXis from 2016 (the year it went public).
In the following lines, we are converting the JSON response into a Pandas dataframe along with some data preprocessing. This is the final output of the code:
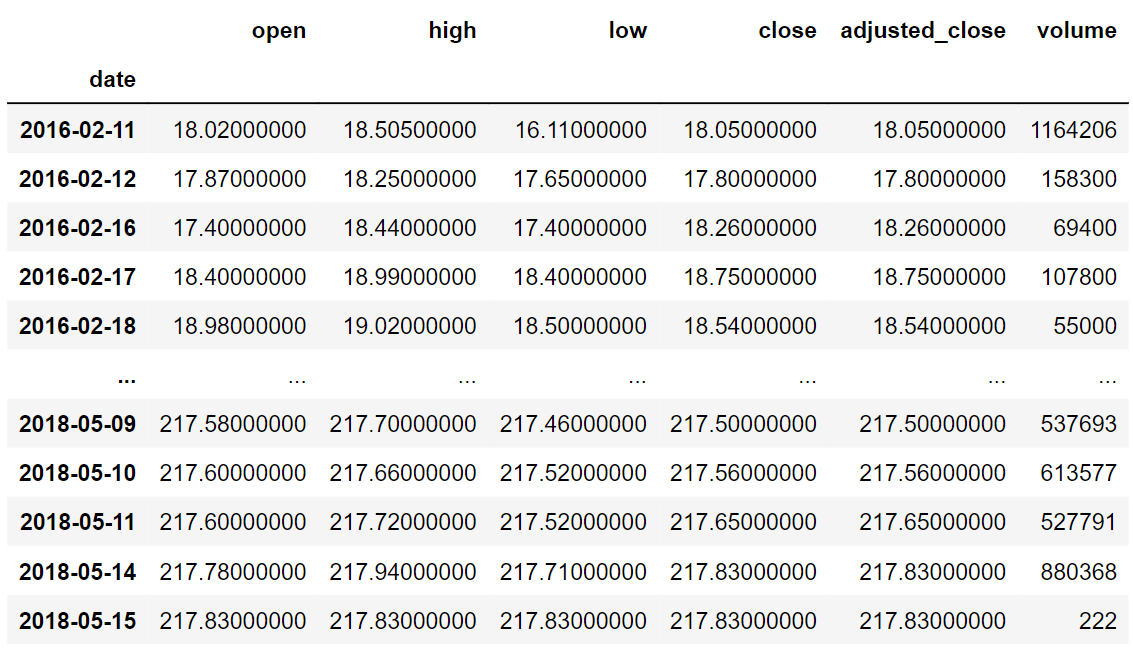
The data spans just over two years which is because of the fact that the stock was traded only for a short period of time before it was acquired.
Extracting EMA Values
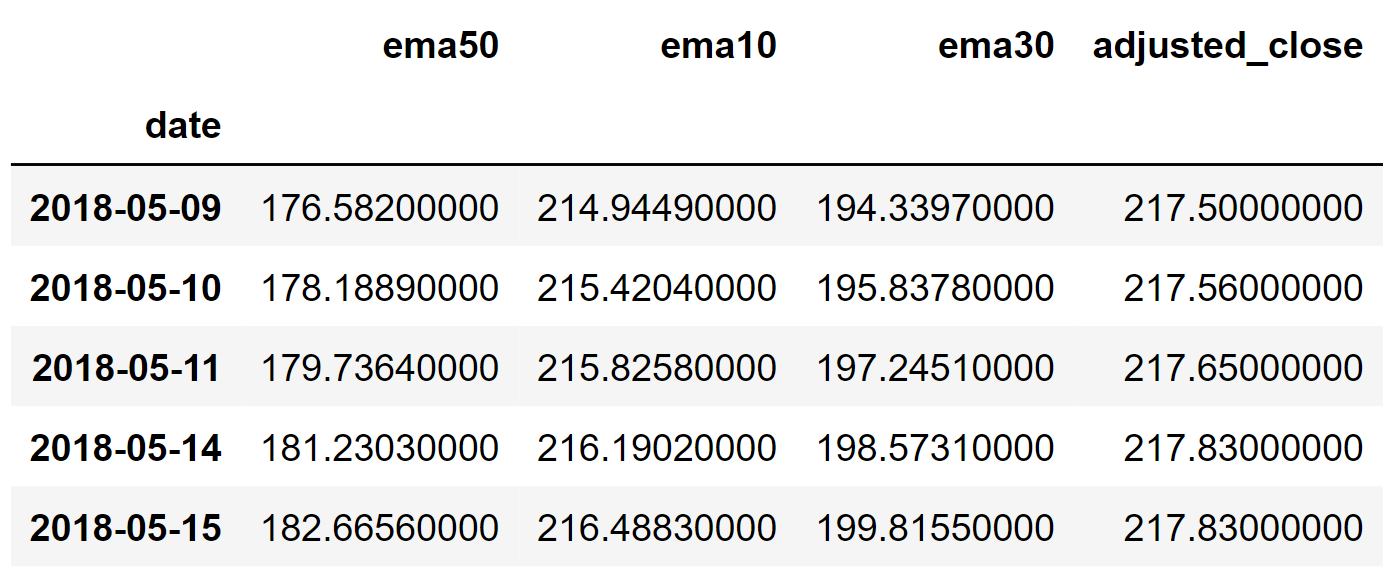
While some people prefer to calculate the EMA values by hard-coding the mathematical formulas, we’re going to follow another route of obtaining the EMA values through APIs. In order to do that, we’re going to use EODHD’s technical indicator API endpoint. The following code uses this specific endpoint to get the EMA values of AveXis:
# EXTRACTING EMA DATA

ema10 = pd.DataFrame(client.get_technical_indicator_data(ticker = 'AVXS.US', function = 'ema', period = 10)).set_index('date').rename(columns = {'ema':'ema10'})
ema30 = pd.DataFrame(client.get_technical_indicator_data(ticker = 'AVXS.US', function = 'ema', period = 30)).set_index('date').rename(columns = {'ema':'ema30'})
ema50 = pd.DataFrame(client.get_technical_indicator_data(ticker = 'AVXS.US', function = 'ema', period = 50)).set_index('date').rename(columns = {'ema':'ema50'})
adj_close = df[['adjusted_close']]

avxs_df = ema50.join([ema10, ema30, adj_close])
avxs_df.index = pd.to_datetime(avxs_df.index)

avxs_df.tail()
The code might look a little fuzzy, but it’s quite simple. In the first three lines, we are extracting the EMA values with different lookback periods. Each is stored in three different dataframes and finally, we combine all of them along with the stock’s adjusted close into a single dataframe and this is the final output:
Now that we have all the required data, let’s move on to constructing and backtesting our 3-EMA crossover trading strategy.
Backtesting the Strategy
Here comes the most important and interesting part of the article, the backtesting of our trading strategy. The following code implements a very simple backtesting system and reveals the results of our trading strategy:
# BACKTESTING THE STRATEGY

def implement_strategy(df, investment):

    in_position = False
    equity = investment

    for i in range(1, len(df)):
        if df['ema10'][i-1] < df['ema30'][i-1] and df['ema10'][i] > df['ema30'][i] and df['ema10'][i] > df['ema50'][i] and in_position == False:
            no_of_shares = math.floor(equity/df.adjusted_close[i])
            equity -= (no_of_shares * df.adjusted_close[i])
            in_position = True
            print(cl('BUY: ', color = 'green', attrs = ['bold']), f'{no_of_shares} Shares are bought at ${df.adjusted_close[i]} on {str(df.index[i])[:10]}')
        elif df['ema10'][i-1] > df['ema30'][i-1] and df['ema10'][i] < df['ema30'][i] and df['ema10'][i] < df['ema50'][i] and in_position == True:
            equity += (no_of_shares * df.adjusted_close[i])
            in_position = False
            print(cl('SELL: ', color = 'red', attrs = ['bold']), f'{no_of_shares} Shares are bought at ${df.adjusted_close[i]} on {str(df.index[i])[:10]}')
    if in_position == True:
        equity += (no_of_shares * df.adjusted_close[i])
        print(cl(f'\nClosing position at {df.adjusted_close[i]} on {str(df.index[i])[:10]}', attrs = ['bold']))
        in_position = False

    earning = round(equity - investment, 2)
    roi = round(earning / investment * 100, 2)

    print('')
    print(cl(f'EARNING: ${earning} ; ROI: {roi}%', attrs = ['bold']))

implement_strategy(avxs_df, 100000)
I’m not going to dive deep into the dynamics of this code as it will take some time to explain it. Basically, the program executes the trades based on the conditions that are satisfied. It enters the market when our entry condition is satisfied and exits when the exit condition is satisfied. These are the trades executed by our program followed by the backtesting results:
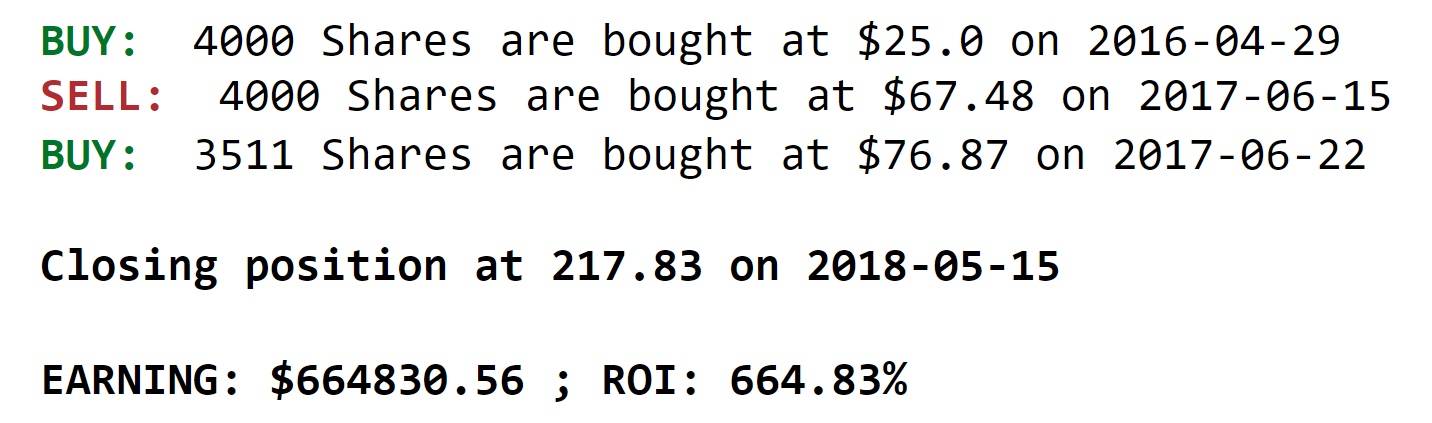
The results are pretty interesting. Over the course of two years, our program executed only three trades in total. This is both a good thing as well as a bad thing. But it all comes down to the returns of our strategy. Our 3-EMA trading strategy generated $664K with an ROI of 664.83%. This is some great news!
Buy/Hold Returns Comparison
A good trading strategy should not just be able to generate profitable returns but must be efficient enough to outperform the buy/hold strategy. To those who don’t know what the buy/hold strategy is, it’s a strategy where the trader buys and holds the stock no matter what the circumstance is for a longer period.
If our strategy beats the buy/hold strategy, we can confidently say that we came up with a good trading strategy that is almost ready to be deployed in the real world. Whereas, if it fails to do so, we either have to make some pretty good amount of changes to the strategy or scrap it entirely. So basically, this step is going to decide if we should move further with our strategy or not.
The following code implements the buy/hold strategy and calculates the returns:
# BUY/HOLD STRATEGY RETURNS

bh_roi = round(list(avxs_df['adjusted_close'].pct_change().cumsum())[-1],4)*100
print(cl(f'BUY/HOLD STRATEGY ROI: {round(bh_roi,2)}%', attrs = ['bold']))
The code follows the simple mathematics behind calculating the stock returns for the given data and this is the output:

After comparing the results of the buy/hold strategy and our 3-EMA strategy, we outperformed the former with a difference of 381% in terms of ROI. That’s amazing! It’s almost 2.3x the returns of the buy/hold strategy. Now it’s pretty confident to say that we have indeed made a good solid trading strategy.
Conclusion
To summarize, we started off by extracting the list of delisted stocks provided by EODHD and chose a stock to backtest our trading strategy. Then we obtained the historical data and the EMA values with different lookback periods of that stock using EODHD’s end-of-day API endpoint and technical indicator API endpoint respectively. After acquiring the required data, we proceeded with constructing and backtesting our 3-EMA trading strategy. Finally, we compared the results of our trading strategy with that of the buy/hold strategy to validate its efficiency.
There is still a lot of scope for improvement which is not touched upon in this article. For example, a proper risk management system can be put in place for a more systematic trading approach. Another example would be using ML models to tune the parameters of the strategy and find the most optimal ones. Even though these are not practically explained in this article, it is very much recommended to check them out. If you want to deploy the strategy, these things can become mandatory.
With that said, you’ve reached the end of the article. Hope you learned something new and useful today. Thank you very much for your time.
Thank you for your comment. You are correct that using delisted stocks can introduce lookahead bias. The purpose of this example was to illustrate the mechanics of backtesting a 3-EMA strategy using available historical data, including delisted stocks. In practical applications, it is crucial to ensure that data reflects the information available at the time of trading to avoid such biases. We appreciate your feedback and will consider it for future improvements.