

Stock Portfolio Spreadsheet
Managing and tracking your investment portfolio is a crucial aspect of successful financial planning. While there are many sophisticated tools available for this purpose, creating a simple and personalized stock portfolio spreadsheet tracker in Google Sheets can offer a high level of customization and control. In this article, we will guide you through the process of building a portfolio tracker using APIs (Application Programming Interfaces) in Google Sheets. You are free to copy or download the template to navigate the article more easily here:
Quick jump:
It’s worth checking our ready-to-use EODHD Add-in for Google Sheets, which could help you to get reliable information directly into your spreadsheet. If you are looking for an Excel portfolio tracker spreadsheet please check the following article.
Setting Up Financial Spreadsheet
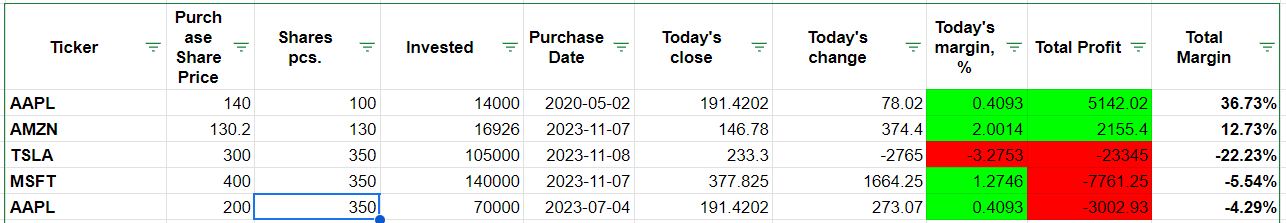
Google Sheets Start by opening a new Google Sheets spreadsheet and organizing it with the necessary columns. Common columns include “Ticker,” “Company Name,” “Quantity,” “Purchase Price,” “Current Price,” and “Market Value.” You can add additional columns based on your preferences, such as dividend yield, sector, or any other relevant information.
API Requests for Dynamic Spreadsheets
Now you have bones of the future portfolio tracker and you need to populate it with data. To create a dynamically updatable spreadsheet we will use Google Sheets’ functions which call data using external URL requests. The most commonly used function is ‘=IMPORTDATA()’.
EODHD provides all the necessary data you need to track your portfolio efficiently. In the article, we will be using a couple of them to give you the basics of working with EODHD APIs:
- Live API – to dynamically track today’s change of the stock
- End-of-Day API – to plot stock price performance
- Fundamentals API – to get fundamental ratios
We recommend you register a free account to get free access to some of our APIs: https://eodhd.com/register
To get full access necessary for a proper stock analysis you can subscribe to our packages here: https://eodhd.com/pricing
Working with API requests
To get the needed data efficiently you need to visit a documentation page of the API. There you can understand how requests and received data are structured.
For live API you can open the link and browse the page to find necessary information. It’s important to understand the functionality and potential output of the API to implement it effectively.
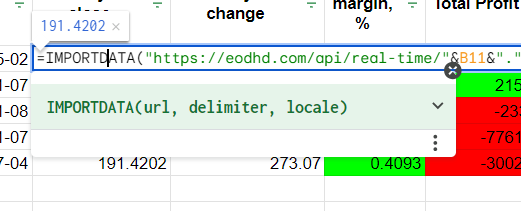
To insert the live data into the cell we will use the following function:
=IMPORTDATA("https://eodhd.com/api/real-time/"&B11&"."&$C$8&"?api_token="&$C$5&"&fmt=json&filter=close")
Note that in the function we use cell values to get ticker (B11), market ($C$8), and API token information ($C$5). The URL itself contains a filter parameter “&filter=close” which will limit the output for the Live API to close price only. “&fmt=json” URL parameter sets output in JSON, for live data we can also choose CSV, however, in this case, we have cleaner data with JSON output.
You can find your API token on your Settings page after the registration. You can also use a “demo” token to get data for AAPL, MSFT, AMZN, and TSLA tickers. The spreadsheet used a demo token you can change it on yours.
Plot Stock Performance Using Historical Data
Having a price chart always helps to get a better understanding of sporting trends, to get Historical data for the line chart we will use the End-of-Day API. You can find an example on a Price Chart bookmark of the template spreadsheet.
Here price chart is generated on selected stock from your portfolio from the time it was bought.
To insert historical data for the plot into table we will use the following function:
=IMPORTDATA("https://eodhd.com/api/eod/"&$B$3&"."&Portfolio!$C$8&"?api_token="&Portfolio!$C$5&"&fmt=csv&filter=adjusted_close&from="&TEXT($C$3,"YYYY-MM-DD")&"&period=d")
Here we also use cell values for ticker($B$3), market(Portfolio!$C$8&), and API token(Portfolio!$C$5). However, for the price range, we need to get a date from the cell in the proper format for this we use the ‘TEXT($C$3,”YYYY-MM-DD”)’ function.
For the stock selected, we used ‘Dropdown‘ menu from the range, and for the automatically updated date used ‘VLOOKUP‘ function.
Financail Ratios Data
One of the core principles of fundamental investing is the analysis of corporate financial ratios. In the spreadsheet, we are using Fundamental API to get core analytical data for the portfolio’s stocks.
To insert fundamental data into the spreadsheet we will use the following function:
=TRANSPOSE(IMPORTDATA("https://eodhd.com/api/fundamentals/"&$B$3&"."&Portfolio!$C$8&"?api_token="&Portfolio!$C$5&"&filter=Highlights"))
As previously we cell values for ticker($B$3), market(Portfolio!$C$8&), and API token(Portfolio!$C$5). In this case, we also need to use the ‘TRANSPOSE‘ Google Sheets function to get the data into the column instead of a line.
For the ratios on the main ‘Portfolio’ page, we use Google’s ‘SUM’ function and algebraic operations supported by the spreadsheet. You can check it by clicking on the cells.
Add New Tickers
To add new tickers you need to poot the ticker code into the left cell of the portfolio table, add the purchase date and the stock price of the transaction.
After you need to simply drag previous cells down and all ratios and current data will be updated in an instance. You can see how it’s done below.
Conclusion
By combining the power of Google Sheets and financial APIs, based on our spreadsheet template you can create a personalized portfolio tracker that suits your specific needs. This approach allows you to stay informed about your investments in real time and empowers you with the flexibility to customize and expand your tracker as needed.
Feel free to contact support to ask for the current discounts, we would be more than happy to assist and guide you through the process.