

Momentum trading centers on buying and selling assets following their recent performance trends. Traders using this strategy believe that assets moving strongly in a direction will continue to do so. They aim to capitalize on this momentum before it fades. Welcome to our in-depth exploration of advanced momentum trading techniques, where we leverage the power of Python to enhance our strategies.
Understanding momentum trading requires grasping two core concepts: trend following and mean reversion. Trend followers believe that stocks moving up or down will continue on that path. In contrast, mean reversion suggests that assets overreact and will eventually return to their mean values.
Momentum trading thrives in markets exhibiting strong trends. It’s less effective in sideways or highly volatile markets. Therefore, identifying the right market conditions is critical for success.
This strategy’s allure lies in its simplicity and effectiveness. However, it’s not without risks. Sudden market reversals can quickly erode gains. Hence, effective risk management is essential.
In our journey through this article, we’ll explore advanced techniques to refine momentum trading. This includes using volatility and volume indicators and implementing robust risk management strategies. These tools enhance decision-making and improve the chances of success in momentum trading.
Next, we’ll delve into the mathematical principles underpinning momentum strategies. Understanding these foundations is key to developing and executing effective trading strategies.
Quick jump:
Mathematical Concepts Behind Momentum Trading
Momentum strategies are rooted in empirical evidence and mathematical models. They’re predicated on the Efficient Market Hypothesis (EMH) contrast. EMH posits that asset prices reflect all available information. However, momentum traders exploit market inefficiencies.
The autocorrelation in stock returns forms the basis of momentum strategies. It implies that stocks showing strong performance in the past are likely to perform well in the near future. This persistence of returns defies the random walk theory, which suggests that stock prices are unpredictable.
Two key theories help explain momentum phenomena:
1. Behavioral Finance Theory: It suggests that investor psychology drives market anomalies. Herd behavior, overreaction, and underreaction to news contribute to trends in stock prices. These psychological factors create momentum opportunities.
2. Risk-Based Explanations: Some theorists argue that higher returns from momentum strategies compensate for higher risks. This risk might be due to macroeconomic factors or market volatility.
Mathematically, momentum is often quantified as the rate of change or the difference in price over a period. The formula is typically:
Momentum = Current Price – Price n Periods Ago
This calculation forms the backbone of many momentum indicators, such as the Relative Strength Index (RSI) or the Moving Average Convergence Divergence (MACD).
Understanding these theoretical and mathematical foundations is crucial. It equips traders with the necessary insights to develop more sophisticated and effective trading strategies.
In the next section, we’ll explore how volatility plays a pivotal role in momentum trading strategies.
Volatility and Its Role in Momentum Trading
Volatility is a key metric in financial markets, representing the degree of variation in an asset’s price. In momentum trading, understanding and measuring volatility is crucial. It offers insights into market uncertainty and potential trade risks.
Volatility can both create and destroy opportunities in momentum trading. High volatility often signals significant trading opportunities, as price movements are more pronounced. However, it also indicates higher risk, as price swings can be unpredictable and sharp.
To effectively incorporate volatility in momentum strategies, traders often use the Standard Deviation of price movements. This metric quantifies how much an asset’s price deviates from its average price over a specific period. The formula for standard deviation in a financial context is:
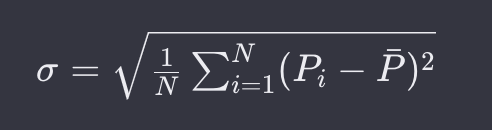
High volatility often signals significant trading opportunities in momentum trading. Yet, it also implies greater risk. This is where reliable historical stock data, such as that from EODHD API, becomes invaluable. EODHD API provides extensive historical financial data, including real-time stock prices, essential for analyzing volatility.
To integrate volatility analysis into momentum trading, let’s start by fetching historical stock data using the EODHD API. We’ll then calculate and visualize the stock’s volatility.
from eodhd import APIClient
import requests
import pandas as pd
import numpy as np
import matplotlib.pyplot as plt
api_key = "your_api_key_here"
def fetch_stock_data(symbol, api_key, start_date, end_date):
api = APIClient(api_key)
data = api.get_historical_data(symbol=symbol, interval="d", iso8601_start=start_date, iso8601_end=end_date)
return data
# Fetching historical stock data
stock_symbol = "NVDA"
start_date = "2022-10-21"
end_date = "2023-11-20"
stock_data = fetch_stock_data(stock_symbol, api_key, start_date, end_date)
# Calculating daily returns
stock_data['Daily_Return'] = stock_data['close'].pct_change()
# Calculating volatility
volatility = stock_data['Daily_Return'].std() * np.sqrt(252)
# Plotting the volatility
plt.figure(figsize=(10, 6))
stock_data['Daily_Return'].plot()
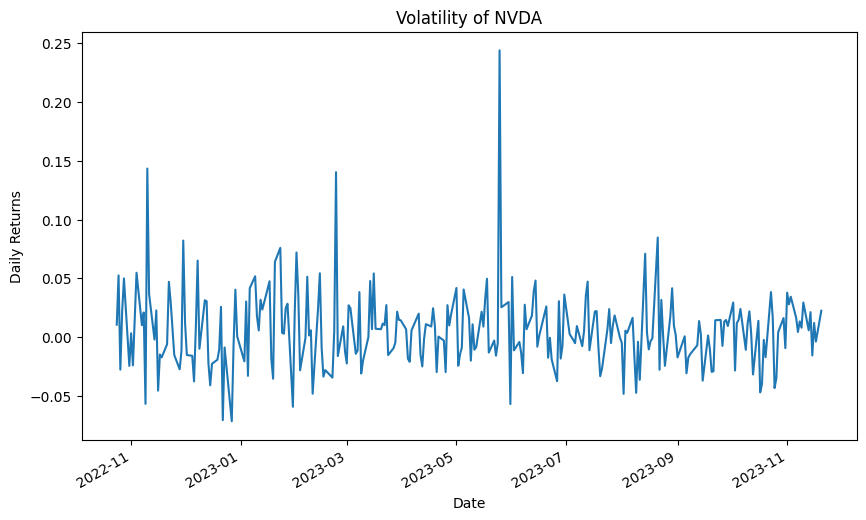
plt.title(f'Volatility of {stock_symbol}')
plt.ylabel('Daily Returns')
plt.xlabel('Date')
plt.show()
This code fetches high quality historical stock data from EODHD API, calculates the daily returns, and then computes the annualized volatility. The visualization of the daily returns offers insight into the stock’s price fluctuations, a key aspect of volatility.
Understanding how to measure and interpret volatility is crucial in momentum trading. It helps traders identify the most opportune moments to enter and exit trades. In the next section, we will delve into the role of volume indicators in enhancing momentum trading strategies.
Volume Indicators: Enhancing Momentum Analysis
Volume indicators play a crucial role in momentum trading, offering additional layers of analysis beyond price movements. They help confirm the strength or weakness of a price trend, providing insights into the sustainability of momentum.
High trading volume typically accompanies strong price movements, reinforcing the momentum signal. Conversely, if a price trend is not supported by significant volume, it might indicate a weak or unsustainable trend.
Key volume indicators include:
- Volume Oscillator: Measures the difference between two moving averages of volume.
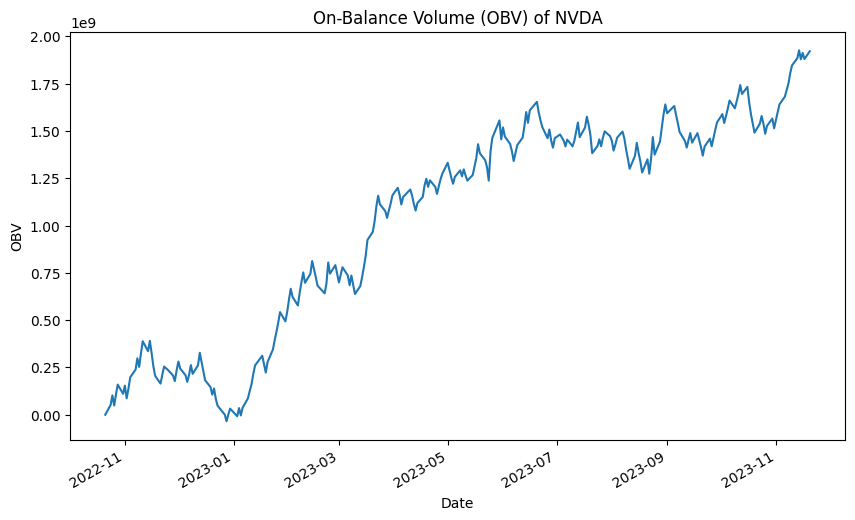
- On-Balance Volume (OBV): Adds volume on up days and subtracts on down days, indicating buying or selling pressure.
- Accumulation/Distribution Line: Considers both volume and price to show how much of a stock is being accumulated or distributed.
We can integrate these indicators with EODHD API data. Let’s extend our Python code to include volume analysis.
This code snippet calculates and visualizes the On-Balance Volume (OBV) for the chosen stock. The OBV line movement provides insights into the stock’s buying and selling pressure, which is invaluable in confirming momentum signals.
# Calculating the On-Balance Volume (OBV)
obv = [0]
for i in range(1, len(stock_data)):
    if stock_data['close'][i] > stock_data['close'][i-1]:
        obv.append(obv[-1] + stock_data['volume'][i])
    elif stock_data['close'][i] < stock_data['close'][i-1]:
        obv.append(obv[-1] - stock_data['volume'][i])
    else:
        obv.append(obv[-1])

stock_data['OBV'] = obv

# Plotting OBV
plt.figure(figsize=(10, 6))
stock_data['OBV'].plot()
plt.title(f'On-Balance Volume (OBV) of {stock_symbol}')
plt.ylabel('OBV')
plt.xlabel('Date')
plt.show()
By combining these volume indicators with volatility analysis, traders can form a more comprehensive picture of market dynamics. This integrated approach enhances decision-making in momentum trading strategies.
Next, we will explore how to build a complete momentum trading model in Python, using both price and volume data.
Building a Momentum Trading Model in Python
Creating a momentum trading model involves several steps, from data sourcing to algorithm development. We’ll use Python to build a basic model, incorporating price, volatility, and volume indicators.
We’ll continue using EODHD API data, as it provides comprehensive market data essential for our model. We’ve already fetched and prepared the stock data in previous sections.
Defining the Momentum Indicator
A simple momentum indicator can be the rate of change (ROC) of the stock’s price. It’s calculated over a specified period and can signal potential buy or sell points.
def calculate_momentum(data, period=14):
	return data['close'].diff(periods=period)

# Adding Momentum to DataFrame
stock_data['Momentum'] = calculate_momentum(stock_data)
We’ve already calculated the volatility and OBV. Let’s integrate these into our trading signals.
Continue with the Momentum Trading Algorithm
The trading strategy might be to buy when the momentum is positive and sell when it’s negative, factoring in volume and volatility thresholds.
def trading_strategy(data):
buy_signals = []
sell_signals = []
for i in range(len(data)):
# Buy if momentum is positive and OBV is increasing
if data['Momentum'][i] > 0 and data['OBV'][i] > data['OBV'][i-1]:
buy_signals.append(data['close'][i])
sell_signals.append(np.nan)
# Sell if momentum is negative
elif data['Momentum'][i] < 0:
sell_signals.append(data['close'][i])
buy_signals.append(np.nan)
else:
buy_signals.append(np.nan)
sell_signals.append(np.nan)
return buy_signals, sell_signals
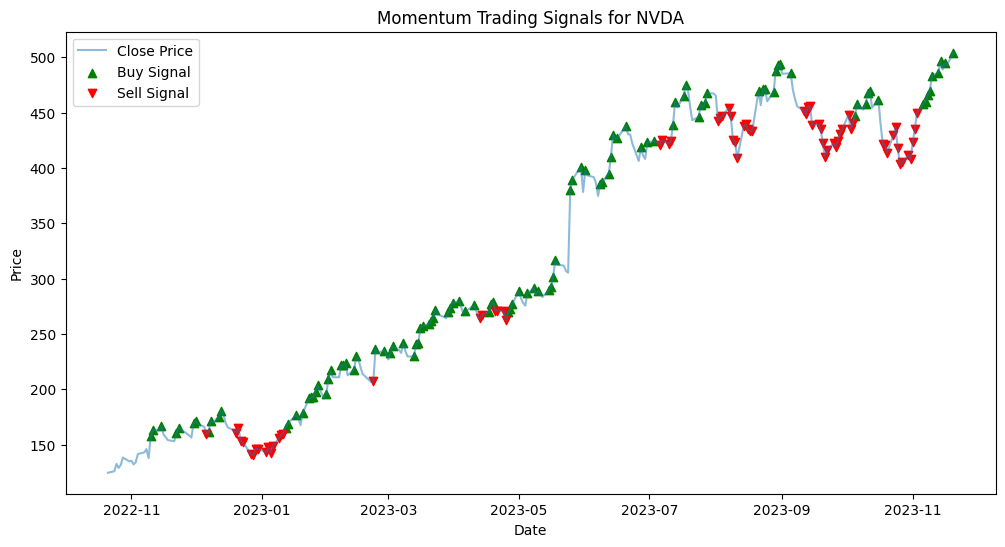
stock_data['Buy_Signals'], stock_data['Sell_Signals'] = trading_strategy(stock_data)Finally, let’s visualize the buy and sell signals along with the stock price.
plt.figure(figsize=(12,6))
plt.plot(stock_data['close'], label='Close Price', alpha=0.5)
plt.scatter(stock_data.index, stock_data['Buy_Signals'], label='Buy Signal', marker='^', color='green')
plt.scatter(stock_data.index, stock_data['Sell_Signals'], label='Sell Signal', marker='v', color='red')
plt.title(f'Momentum Trading Signals for {stock_symbol}')
plt.xlabel('Date')
plt.ylabel('Price')
plt.legend()
plt.show()
This model is a basic representation and should be further refined with backtesting, optimization, and risk management measures, which we will discuss in subsequent sections.
In our next section, we will delve into advanced techniques in momentum trading, enhancing our strategy further.
Advanced Techniques in Momentum Trading
To elevate our momentum trading strategy, we can integrate advanced techniques. These include machine learning for predictive analysis and multifactor models. Let’s explore how to enhance our Python-based momentum trading model with these approaches.
Machine Learning for Predictive Analysis
Machine learning can analyze vast datasets to identify patterns and predict future price movements. A simple example is using a classification model to predict whether to buy, hold, or sell a stock.
from sklearn.ensemble import RandomForestClassifier
from sklearn.model_selection import train_test_split
from sklearn.metrics import accuracy_score

# Features can include 'Momentum', 'OBV', and other technical indicators
# Target is whether to buy (1), hold (0), or sell (-1)

X = stock_data[['Momentum', 'OBV']]
y = # You can define target based on trading strategy

# Splitting the dataset
X_train, X_test, y_train, y_test = train_test_split(X, y, test_size=0.3)

# Training the model
model = RandomForestClassifier()
model.fit(X_train, y_train)

# Testing the model
predictions = model.predict(X_test)
print(f"Model Accuracy: {accuracy_score(y_test, predictions)}")
Multifactor Models
Combining momentum with other factors, like value or quality, can enhance the strategy. This multifactor approach diversifies risks and captures different market aspects
# Combining Momentum with Earnings Quality
def earnings_quality_score(data):
    # Placeholder for calculating earnings quality
    return score

stock_data['Earnings_Quality'] = earnings_quality_score(stock_data)
In this model, we could combine the momentum signal with an earnings quality score. Trades would be triggered not just based on momentum but also on the financial health of the company.
Conclusion
Throughout this article, we explored advanced momentum trading techniques, highlighting the integration of volatility and volume indicators, and the incorporation of sophisticated risk management strategies. Using the EODHD API, we fetched detailed historical stock data, crucial for accurate and timely analysis in momentum trading. We delved into Python coding, crafting a momentum trading model and enhancing it with machine learning and multifactor approaches.
Here is my another article on breakout trading, I would recommend to give that a read.