How to create custom trading candlesticks in Python and why?
Important terminology and trading basics
Before I continue, you will need to have a grasp of some important terminology and trading basics.
If you want to learn how to install the EODHD APIs Python Financial Official Library and activate your API key, I recommend to start with exploring of our Documentation for it.
Let’s start with a “ticker”. What is it?
A ticker represents any price change in a market. It is a constant stream of price changes. If you want to retrieve this live data, you will use a websocket. The Python library I developed for EODHD APIs provides this functionality for you, and you can find a working example here…
eodhd/example_websockets.py at main · whittlem/eodhd
https://github.com/EodHistoricalData/EODHD-APIs-Python-Financial-Library/blob/main/example_websockets.py
The ticker in isolation does not help us determine when to buy or sell in a market. In order to do this we need to look at the historical data for a market. Now you can image trying to analyse hundreds of thousands or even millions of price changes without any time reference won’t help you. This is where granularity/resolution/interval comes into play.
What is “granularity/resolution/interval” in a market?
These words get used interchangeably depending on the exchange, but really they are the same thing. An “interval”, “granularity” or “resolution” is a sort of grouping of price information. An “interval” of 1 hour means that all price data for each hour will be consolidated. Each interval of data (in this case an hour) is represented as a “candlestick”.
What is a “candlestick” in trading?
A candlestick represents one interval, in our case, an hour. It is made up of the Open, High, Low, and Close. The Open is the first price of the hour, the High is the highest price of the hour, the Low is the lowest price of the hour, and the Close is the last price of the hour. In algorithmic trading this is often known as “OHLC”. In fact if you search for “OHLC” in your search engine you will find loads of information about it. You may also see “OHLCV”. The V is for Volume, and the sum of the volume of trades done within the hour.
On trading graphs you will see a series of candlesticks which look like this.
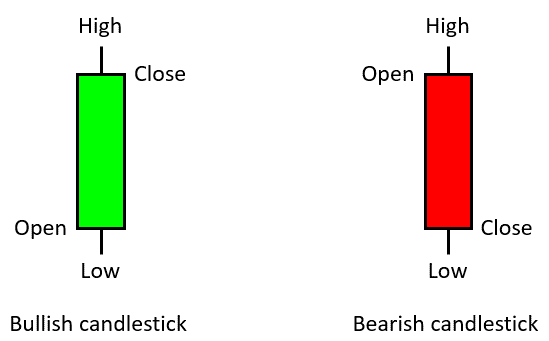
What determines if a candlestick is green or red depends on if the candlestick closes closes higher or lower than the opening price.
Why would you want to create your own trading candlesticks in Python?
Not all exchanges and data providers support all intervals. If you compare EODHD APIs, TradingView, Coinbase, Binance, IG, etc. you will see there is a vast range of options.
You may also want to construct your own trading candlesticks in Python from a websocket price ticker feed. If you have a constant stream of ticker information coming in, what you would do is capture the first price of the interval (that would be your Open, High, and Low). When subsequent prices come in you will check if the price is higher or lower than the current High or Low. If there is a difference, then set the appropriate value. When you reach the end of the interval you will set the closing price of the interval in Close. If you are capturing the volume data, you will just sum up the total volume and assign it to Volume. At the end of the interval you should have a candlestick with the opening price, highest price of the interval, lowest price of the interval, and the closing price.
If you are interested in how I did this, you can check the code in my PyCryptoBot project.
Look at the WebSocketClient class.
Creating our first custom trading candlesticks in Python
There are a few ways this can be done, and I’ll show you two of them. Most exchanges and data providers only provide a maximum of 1 hour or 6 hour intraday intervals. What if we wanted “weekly” trading candlesticks in Python? This is a really powerful interval to plot a long term trend, but not many provide it.
I’m going to use a Jupyter notebook in Google Colab. It’s free and easy to use if you want to follow along. I’m also going to use the EODHD APIs end-of-day demo key to demonstrate this.
The first step is we need to import our libraries.
import json
import requests
import pandas as pd
from datetime import datetime, timedelta
We then want to retrieve the daily data for Apple’s stock (AAPL) and store it in a Pandas dataframe.
resp = requests.get("https://eodhistoricaldata.com/api/eod/AAPL?api_token=demo&fmt=json")
json_data = json.loads(resp.content)
df = pd.DataFrame(json_data)
df
If all has gone to plan so far it should look like this.

10537 days of Apple data!
“close” and “adjusted_close” are very similar, but I’m not going to get into the difference now, we’ll use “close” for this tutorial. Actually to avoid confusion I will just remove it.
df.drop(columns=["adjusted_close"], inplace=True)
df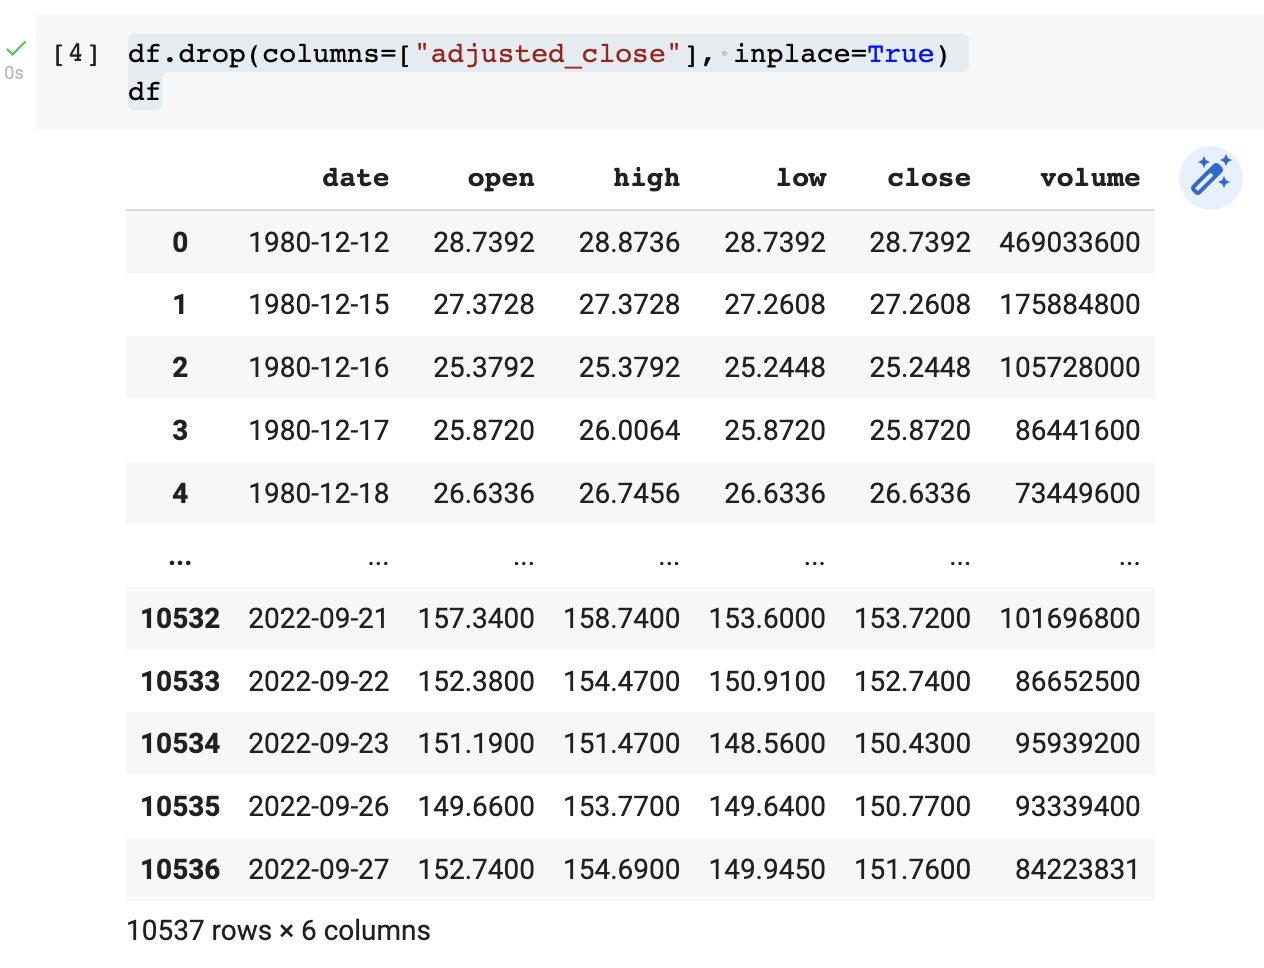
As I explained above, we can see the day (“date”), opening price for the day, high of the day, low of the day, close of the day, and the volume for the day. What we want to do now is create weekly candlesticks from this.
There is one “gotcha” I want to point out first…
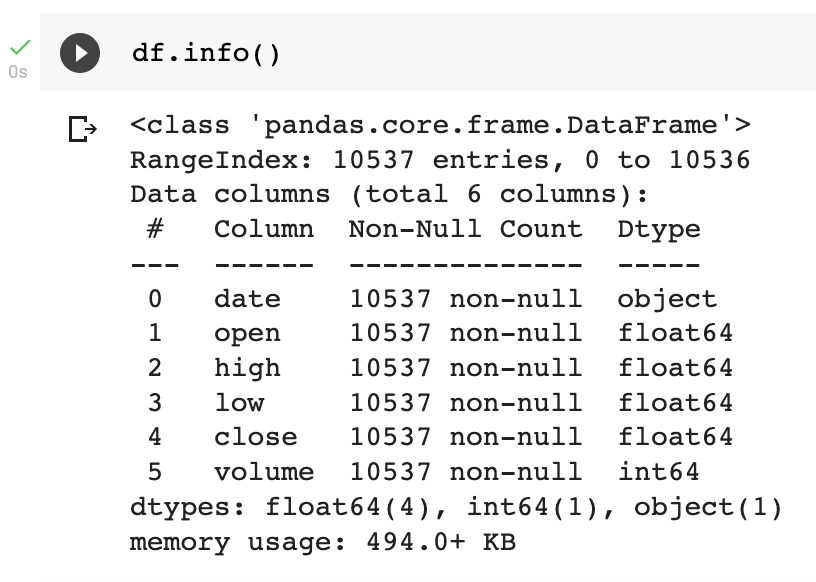
Pandas thinks that the “date” column is of type “object”. That will need to be a datetime type for this to work. The way we update this is as follows.
df["date"] = pd.to_datetime(df["date"])
df.info()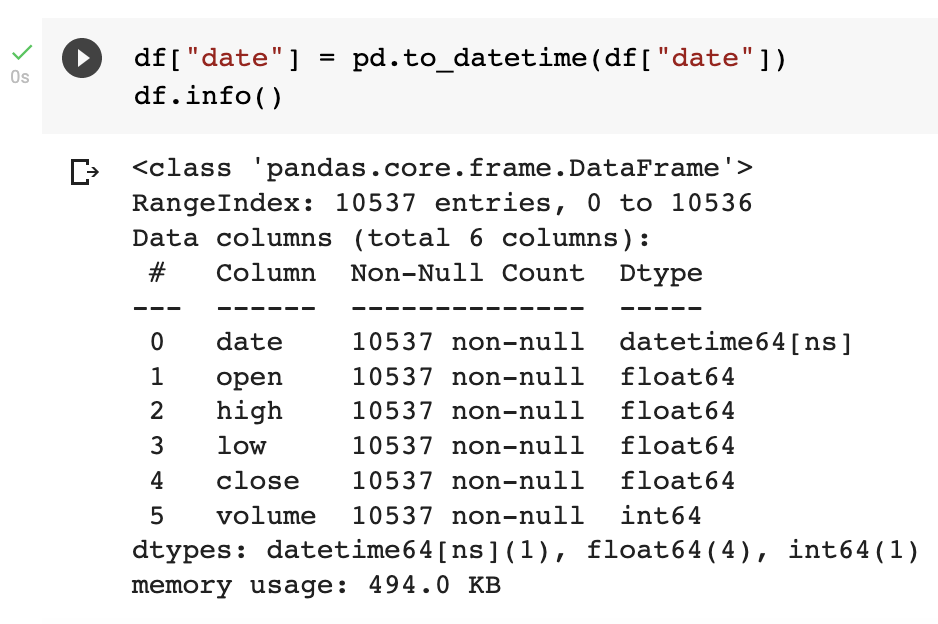
I’m going to provide the complete code to do this, then explain it…
df_weekly = df.copy()
df["day_of_week"] = df["date"].dt.weekday
df["1st_day_of_week"] = df["date"] - df["day_of_week"] * timedelta(days=1)
df_weekly.drop(columns=["date"], inplace=True)
df_weekly.rename(columns={"1st_day_of_week": "date"}, inplace=True)
df_weekly = df_weekly[["date", "open", "high", "low", "close", "volume"]].groupby(["date"]).agg({"open": "first", "high": ["max"], "low": ["min"], "close": "last", "volume": ["sum"]})
df_weekly.columns = ["open", "high", "low", "close", "volume"]
df_weekly
I make a copy of our dataframe “df” and store it in a new variable called “df_weekly”.
df_weekly = df.copy()I created a new column/feature called “day_of_week” which has a numeric value for the day of the week. Monday starts with 0.
df["day_of_week"] = df["date"].dt.weekdayI then wanted to determine what was the first day of every week.
df["1st_day_of_week"] = df["date"] - df["day_of_week"] * timedelta(days=1)I no longer want to keep the daily “date”, so I dropped the column/feature.
df_weekly.drop(columns=["date"], inplace=True)I then renamed my “1st_day_of_week” column/feature to “date”. That will become the date I want to show for each weekly candlestick.
Now this is where the magic happens. What this is doing is grouping all the data by the “date”. The “date” will show the first day of every week for all the days of the week. By aggregating it we consolidate all the days for the week. What you then need to do is tell Pandas what to do with the aggregated data. For the “open”, I said I want the first “open”. For the “high”, I want the highest “high” For the “low”, I want the lowest “low”. For the “close”, I want the last “close”. Finally, for the “volume” I want the sum of the “volume” entries.
df_weekly = df_weekly[["date", "open", "high", "low", "close", "volume"]].groupby(["date"]).agg({"open": "first", "high": ["max"], "low": ["min"], "close": "last", "volume": ["sum"]})I then want to update the aggregated column names and display the datagrame.
df_weekly.columns = ["open", "high", "low", "close", "volume"]
df_weekly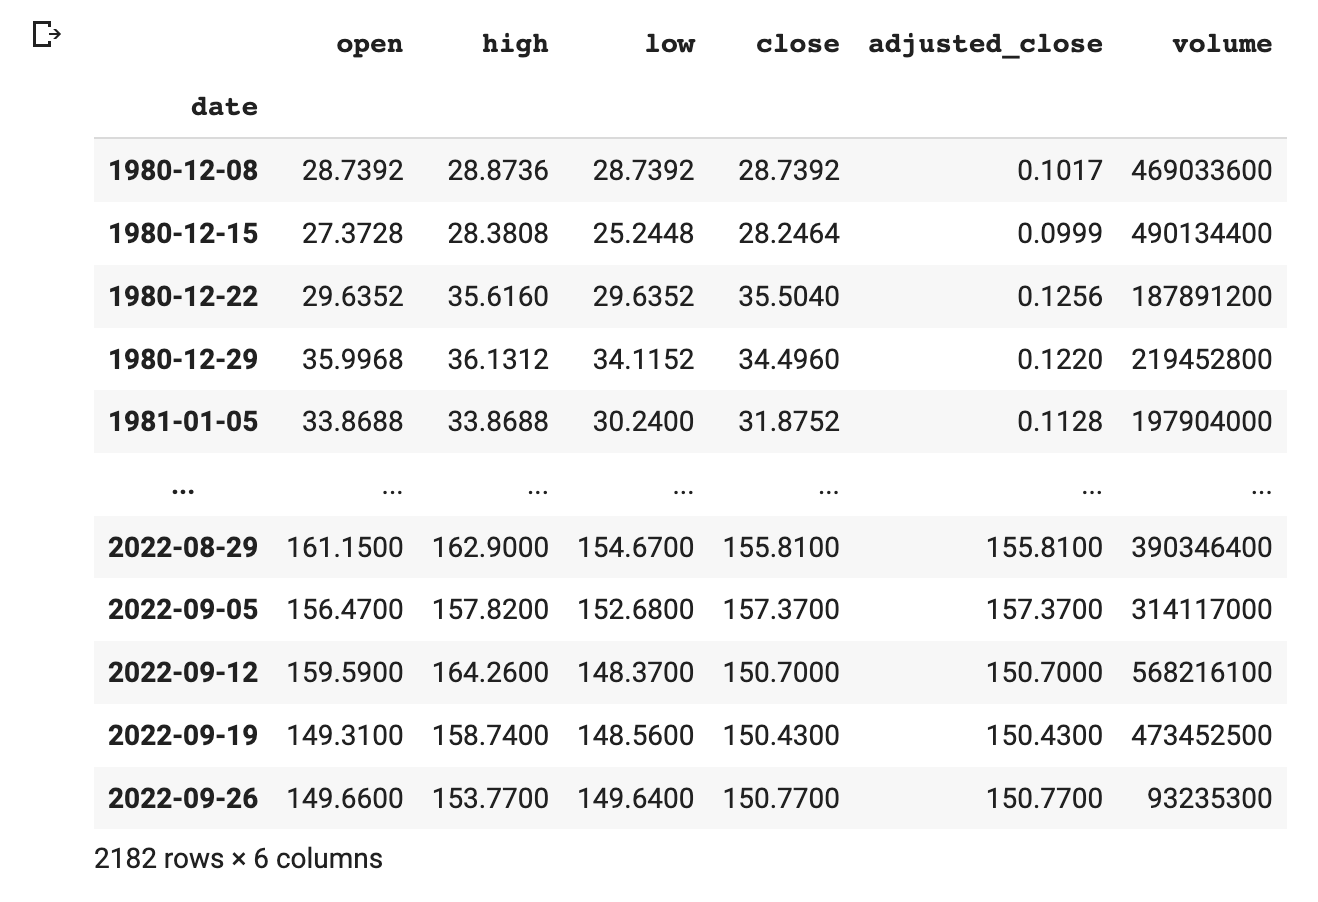
Another way to create custom candlesticks
Let’s say we have 1 minute candlesticks but want to create 15 minute candlesticks.
First, let’s retrieve our 1 minute candles and store it in a dataframe called “df”.
resp = requests.get("https://eodhistoricaldata.com/api/intraday/AAPL.US?api_token=demo&interval=1m&fmt=json")
json_data = json.loads(resp.content)
df = pd.DataFrame(json_data)
df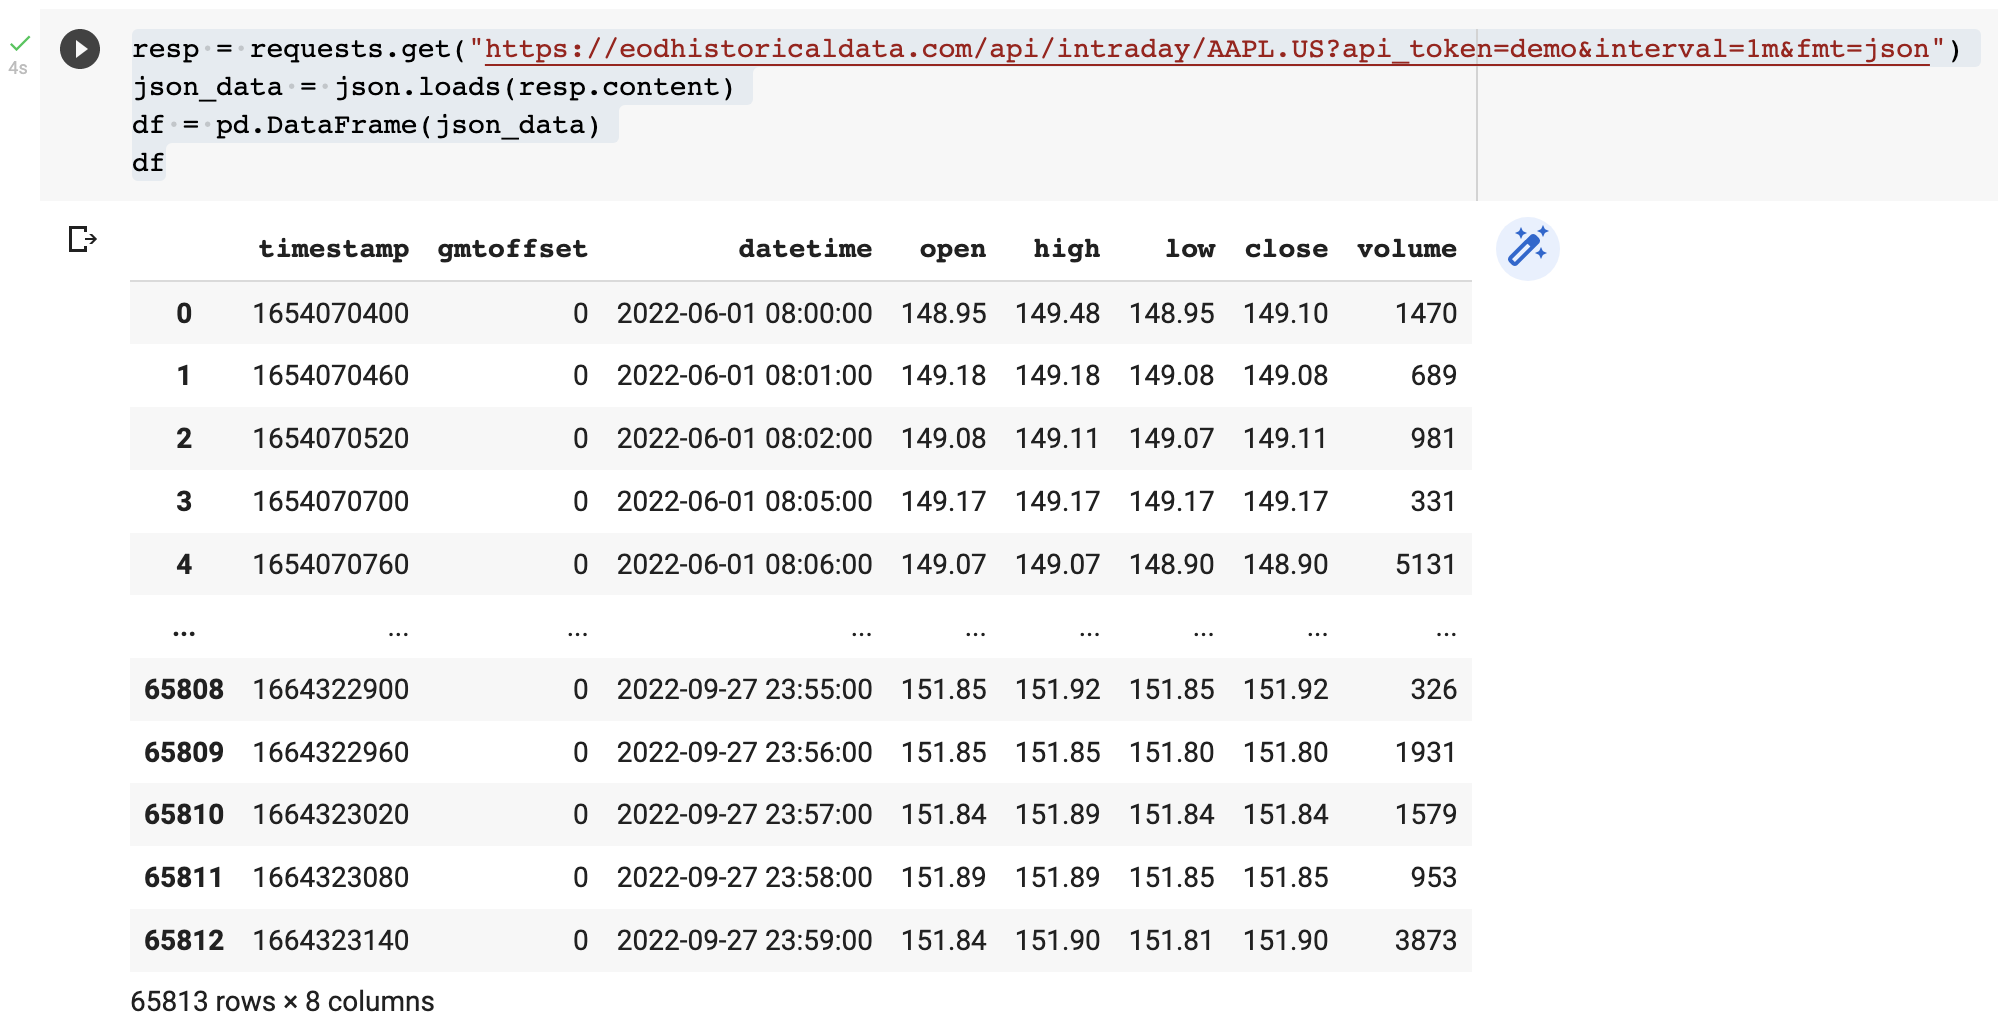
65813 minutes for Apple stock data. That should do the trick!
There is this amazing feature of Pandas called “resample”, and it’s surprisingly easy to use.
df_15m = df.resample("15T", on="datetime").agg({"open": "first", "high": ["max"], "low": ["min"], "close": "last", "volume": ["sum"]})
df_15m.columns = ["open", "high", "low", "close", "volume"]
df_15m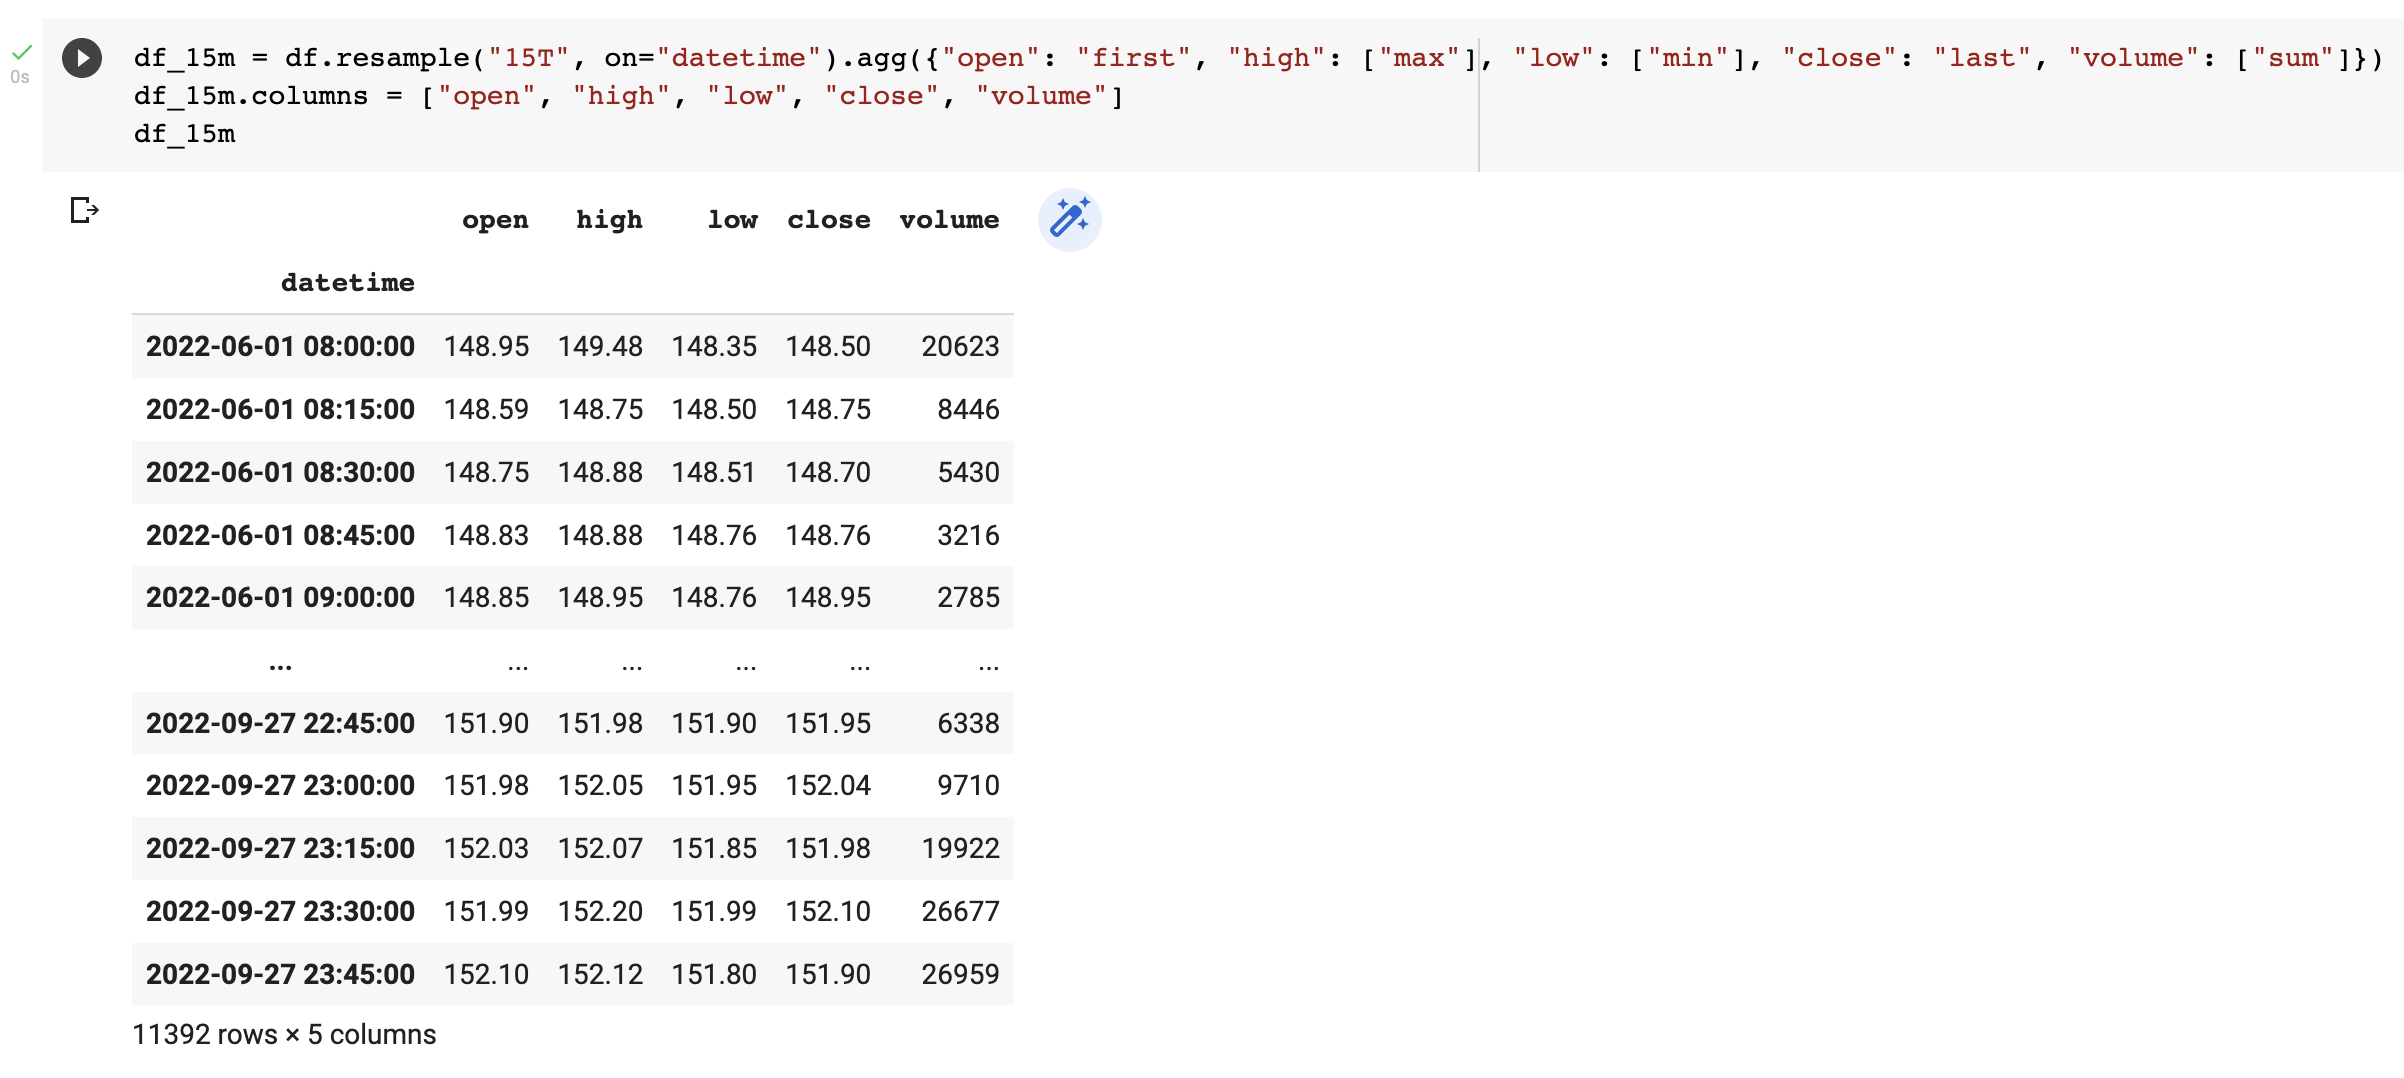
As you can see, 1 minute candles have been consolidated into 15 minutes with the same aggregation rules we defined earlier. The “15T” is what what tells Pandas resample to use 15 minute samples.
For more information about all the Pandas resampling options, you can read up on the official documentation here: https://pandas.pydata.org/docs/reference/api/pandas.DataFrame.resample.html
Conclusion
As you can see, it’s straightforward to create your own interval candlesticks if required. What can be an incredibly powerful and effective strategy in trading is to overlay different intervals over each other.
With cryptocurrency trading — I often look at the 5 minute, 15 minute and 1 hour graphs at the same time. They can act as a very powerful confirmation mechanism. If you think about it, whatever is happening in the 5 minute graphs will start reflecting later in the 15 minute graphs, and what is happening the 15 minute graphs will start reflecting later in the hourly graphs. If you are trading on the 1 hour graphs and start seeing the market’s change in the 5 minute graphs, then the 15 minute graphs, it’s time to get out! Or get in, depending on what is happening.
A really good strategy is to take the SMA200 of the weekly graphs for the long term trend, the SMA200 of the daily for the medium term trend, and the SMA200 of the hourly. If the SMA200 on the weekly is above the SMA200 on the daily and the SMA200 on the daily crosses above the SMA200 on the hourly that is a very strong buy signal.

