

In the world of finance, having access to accurate and timely data is crucial. When it comes to analyzing market indices, such as the S&P 500, understanding the individual companies that make up these indices is key to making informed investment decisions. The article shows why focusing on index constituents matters and how historical analysis can provide valuable insights.
Quick jump:
What are Indices’ Constituents
Think of an index as a well-balanced portfolio, curated to represent a specific market segment, sector, or economic theme. Each company within this portfolio contributes to the overall performance and risk profile of the basket. These individual stocks form the backbone of its movement and provide valuable insights into its underlying dynamics.
The inclusion of companies within an index is governed by specific criteria and methodology established by the index provider. Some key factors considered include:
- Market Capitalization: Larger companies, reflecting their greater influence on the market, typically hold greater weight within an index.
- Liquidity: Stocks with high trading volume ensure smooth buying and selling within the index, facilitating efficient portfolio management.
- Industry Representation: Indices strive to accurately reflect the composition of their target market by including companies from relevant sectors, providing a comprehensive overview of the chosen segment.
- Financial Health: Constituents generally need to demonstrate sound financial performance and meet specific profitability metrics to ensure stability and minimize risk within the index.
Why Analysis of the Building Blocks Matters
The performance of an index is inherently intertwined with the performance of its constituents. Strong showings by key players can propel the index upwards, while significant losses by others can cause it to decline. By demystifying the composition of an index, investors gain invaluable knowledge, enabling them to:
- Gauge Sector Exposure: Analyze the industries and sectors represented by the constituents to accurately assess their portfolio’s exposure to specific areas of the market.
- Evaluate Diversification: Assess the risk profile of an index by examining the weightings of its individual holdings. A heavily weighted index towards a few companies might indicate less diversification compared to one with a more balanced composition.
- Identify Potential Drivers: Research the individual companies within the index to understand their business models, growth prospects, and potential catalysts for future performance. This knowledge allows for well-informed decisions based on individual company fundamentals.
Getting the Right Data
Finding a reliable source of data for index constituents is crucial for making informed investment decisions. For financial research EODHD provides indices’ constituents, as well as historical and live financial data for individual stocks.
List of constituents you can get by using our Fundamentals API for a particular index. Below is an example of a Fundamental API request for S&P 500:
https://eodhd.com/api/excange/GSPC.INDX?api_token=YOUR_API_TOKEN
To get the list of indices you will need to use Exchanges API. An URL API request for the list of indices is the following:
https://eodhd.com/api/exchange-symbol-list/INDX?api_token=YOUR_API_KEY
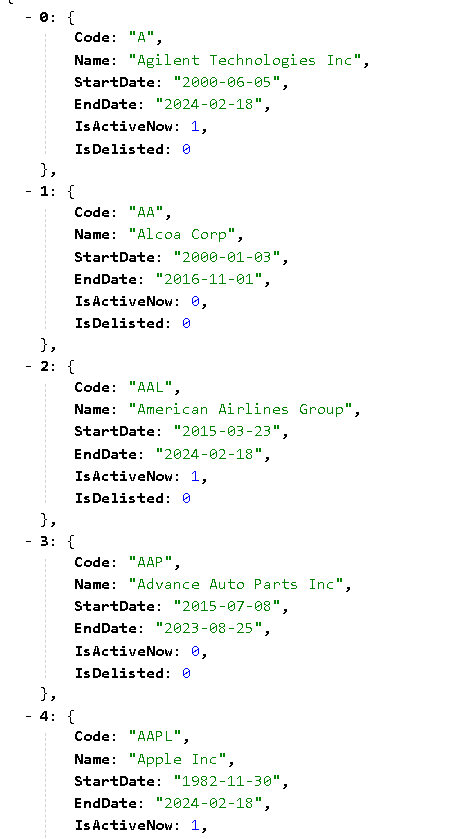
Apart from current index constituents provides access to historical constituents for S&P 500. This could help to analyze the market’s historical performance. An example of the request is the following:
https://eodhd.com/api/fundamentals/GSPC.INDX?api_token=YOUR_API_KEY&fmt=json&&filter=HistoricalTickerComponents
Parameter “&filter=HistoricalTickerComponents” limits the output of the API to only the Historical Components section of the index fundamental API. You can check how to structure the correct API request in our documentation.
After getting a list of tickers and timeframes of them being included in S&P500 you could call EOD Historical API for each of them for a given period with the following URL API request:
https://eodhd.com/api/eod/TWTR.US?from=2020-01-05&to=2020-02-10&period=d&api_token=YOUR_API_KEY
It is important to mention that our data also include delisted tickers, which helps to avoid survivorship bias in historical financial market analysis.
To get the list of supported indices you could call our exchanges API. An URL API request for the list of indices is the following:
https://eodhd.com/api/exchange-symbol-list/INDX?api_token=YOUR_API_KEY
Conclusion
The need for comprehensive financial data for index constituents cannot be overstated. By delving beneath the surface of market indices and analyzing the individual companies that comprise them, investors can gain a deeper understanding of market dynamics, identify emerging trends, and unlock new investment opportunities. With the power of advanced data analytics and technology at their fingertips, investors have the tools they need to navigate today’s complex financial markets with confidence and precision.
Feel free to contact our amazing support to ask for the current discounts, we would be more than happy to assist and guide you through the process.