

Dividend analysis stands as a cornerstone for making informed investment decisions. It’s not just about identifying stocks with high dividend yields. It involves understanding the stability and sustainability of these dividends over time. This insight is crucial for long-term investment strategies, especially in volatile markets.
This article will deep dive into the dividend data analysis. We will explore different features of dividend data, process them and then finally calculate necessary metrics required to perform dividend anaysis using python programming.
Python’s powerful libraries and frameworks simplify complex financial analyses. Deep learning, which is a subset of machine learning, further elevates this analysis. It uncovers patterns in vast datasets, impossible for human analysts to detect. These patterns can predict future dividend behaviors, offering a significant edge in trading.
Quick jump:
Central to our discussion is the EOD Historical Data (EODHD) API. This API provides extensive financial data, including dividend histories which is crucial for our analysis. By combining Python’s analytical prowess with deep learning algorithms and the rich real time financial data from EODHD API, we can gain great insights from the dividend data. These insights enable traders to make more nuanced, data-driven decisions.
As we delve deeper into this topic, we’ll explore how to leverage these tools effectively. Our goal is to enhance trading strategies through advanced dividend analysis.
Configuring Python and EODHD API for Dividend Data Analysis
To start, setting up Python for financial analysis is key. Install libraries like Pandas, NumPy, and Matplotlib. These are essential for handling and visualizing financial data. Next, integrate the EODHD API. It’s a treasure trove of financial data, crucial for dividend analysis.
Here’s a basic guide to get you started with the EODHD API in Python:
Creating a Python Virtual Environment
- This isolates your project and its dependencies.
- Use commands like
python3 -m venv myenvandsource myenv/bin/activate.
In place of “myenv” you can give your environment name. and then activate your environment. You can skip this step if you don’t like to create new environment and would like continue with your existing one.
Installing the EODHD API Library
To fetch live/real-time stock data, you will need to have this library installed. You can also use requests library in python by installing EODHD python library. It is recommended to do, as you will be able to explore many other relevant functionality that can help you in your analysis.
- Use pip to install:
pip install eodhd -U. - This command ensures you have the latest version.
Similarly you can install other libraries like numpy, pandas, matplotlib and other necessary libraries.
Importing Necessary Libraries
Begin by importing libraries and the EODHD API client:
import pandas as pd
import numpy as np
import matplotlib.pyplot as plt
from eodhd import APIClient
import requests
Setting Up the EODHD API Client
Now we can start using EODHD API to start our dividend analysis. Initialize the client with your API key. You can get access to this key from EODHD API access page.
api_key = "Your_API_Key"
base_url = 'https://eodhistoricaldata.com/api'Fetching Historical Dividend Data
You can use the following function to retrieve dividend data for any specific stock. Here I will be using Nvidia stock for further dividend analysis.
# Function to fetch dividend data
def fetch_dividend_data(symbol):
endpoint = f"{base_url}/div/{symbol}"
params = {
'api_token': api_key,
'fmt': 'json'
}
response = requests.get(endpoint, params=params)
if response.status_code == 200:
return response.json()
else:
return None
stock_symbol = 'NVDA'
dividend_data = fetch_dividend_data(stock_symbol)
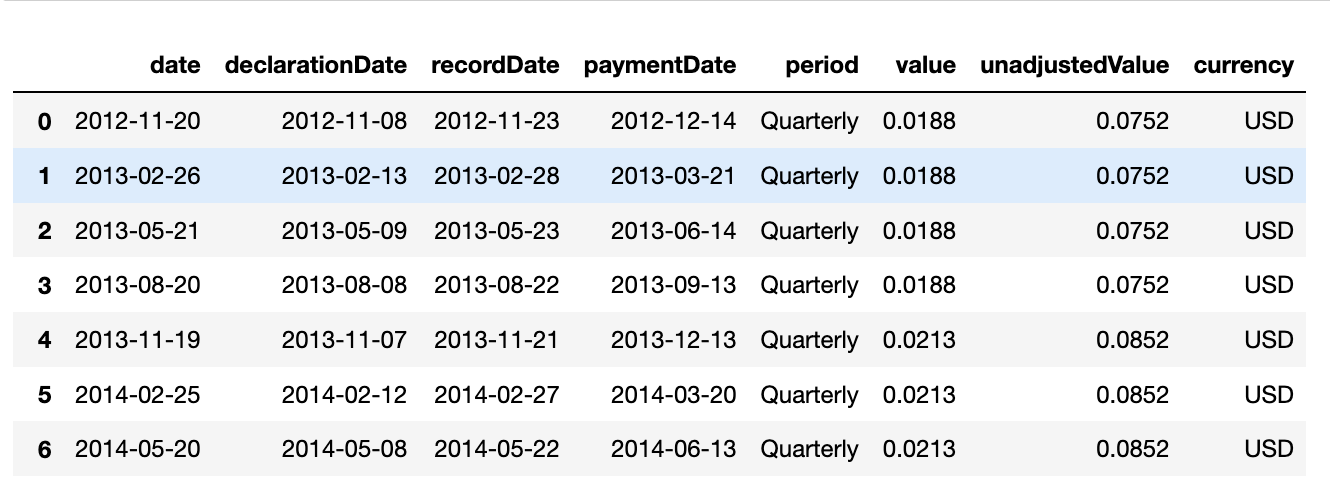
df_nvda = pd.DataFrame(dividend_data)Now we have the dividend data for Nvidia. Here’s how our data looks like.
Data Preparation and Visualization
Let’s now add some other features like year, and make some data processing. Here is the demo visualization that shows how dividend is changing throughout the years since 2012.
df_nvda['date'] = pd.to_datetime(df_nvda['date'])
df_nvda['paymentDate'] = pd.to_datetime(df_nvda['paymentDate'])
df_nvda.sort_values('date', inplace=True)

df_nvda['year'] = df_nvda['date'].dt.year
df['dividend_change'] = df.groupby('year')['value'].transform(lambda x: x.pct_change())

plt.figure(figsize=(12,6))
plt.plot(df_nvda['date'], df_nvda['dividend'], marker='o', color='b')
plt.xlabel('Date')
plt.ylabel('Dividend Value')
plt.title('Quarterly Dividend Trend for NVDA')
plt.grid(True)
plt.show()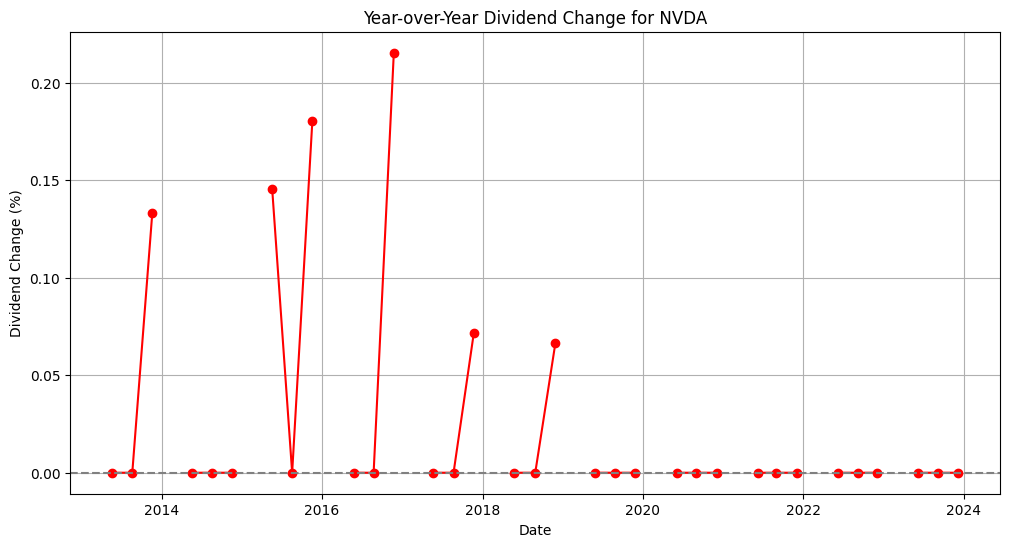
The plot showcasing NVDA’s dividend change percentage reveals a series of notable spikes over the past decade. These spikes indicate years where NVDA has significantly increased its dividend payouts. The pattern is not uniform, suggesting that dividend increases are not merely a function of a consistent policy but are likely influenced by a variety of factors including financial performance, strategic decisions, and market conditions.
Mathematical Foundations of Dividend Analysis
Delving into the mathematical aspects of dividend analysis, we focus on quantifiable metrics that shed light on a company’s dividend policies and stability. These metrics are pivotal for investors seeking to understand and forecast dividend distributions.
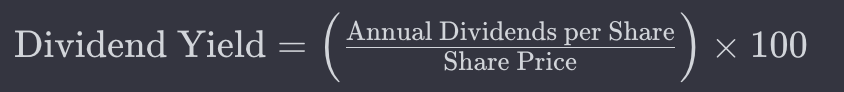
Dividend Yield
The dividend yield is a financial metric indicating how much a company pays out in dividends each year relative to its share price. It’s expressed as a percentage and is a key indicator of the income an investment generates.
Mathematical Formula:
Payout Ratio
This ratio compares the total dividends paid to shareholders to the company’s net income, revealing how much income is being returned to shareholders versus being reinvested in the company.
Mathematical Formula:

Dividend Growth Rate
The dividend growth rate measures the year-over-year growth percentage of a company’s dividend, offering insight into the growth trend of a company’s payouts.
Mathematical Formula:

For the EODHD API data, we can calculate these metrics using Python as follows:
def fetch_stock_price(symbol, api_token):
api = APIClient(api_token)
data = api.get_historical_data(symbol=symbol, interval="d", iso8601_start="2012-01-01")
return data
stock_prices = fetch_stock_price('NVDA', api_key)
df_prices = pd.DataFrame(stock_prices)
df_prices.reset_index(inplace=True)
df_merged = pd.merge_asof(df.sort_values('date'), df_prices.sort_values('date'), on='date')
df_merged['dividend_yield'] = df_merged['value'] / df_merged['close']
# Function to fetch annual earnings (net income) data
def fetch_annual_earnings(symbol, api_token):
income_statement_endpoint = f"{base_url}/fundamentals/{symbol}"
params = {
'api_token': api_token,
'fmt': 'json'
}
response = requests.get(income_statement_endpoint, params=params)
if response.status_code == 200:
# Extracting the annual income statement data
income_data = response.json()['Financials']['Income_Statement']['yearly']
return {year: data['netIncome'] for year, data in income_data.items()}
else:
return None
net_income_data = fetch_annual_earnings('NVDA', api_key)
net_income_data = {int(key.split("-")[0]):int(float(value)) for key, value in net_income_data.items() if int(key.split("-")[0]) >= 2012}
# Calculating the total dividends paid annually
annual_dividends = df.groupby('year')['value'].sum()
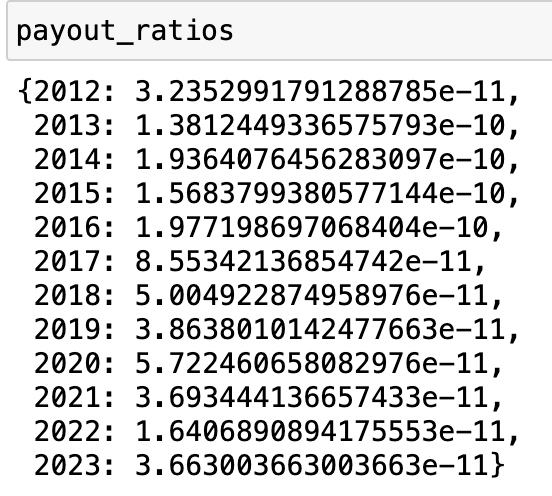
# Calculating the payout ratio
payout_ratios = {}
for year, dividends in annual_dividends.items():
if year in net_income_data:
payout_ratios[year] = dividends / net_income_data[year]
dividend_growth_rates = df['dividend_change'].dropna()
average_dividend_growth_rate = dividend_growth_rates.mean()These python snippets help us calculate different metrics like dividend yield, payout ratio and dividend growth rate that helps in dividend analysis.
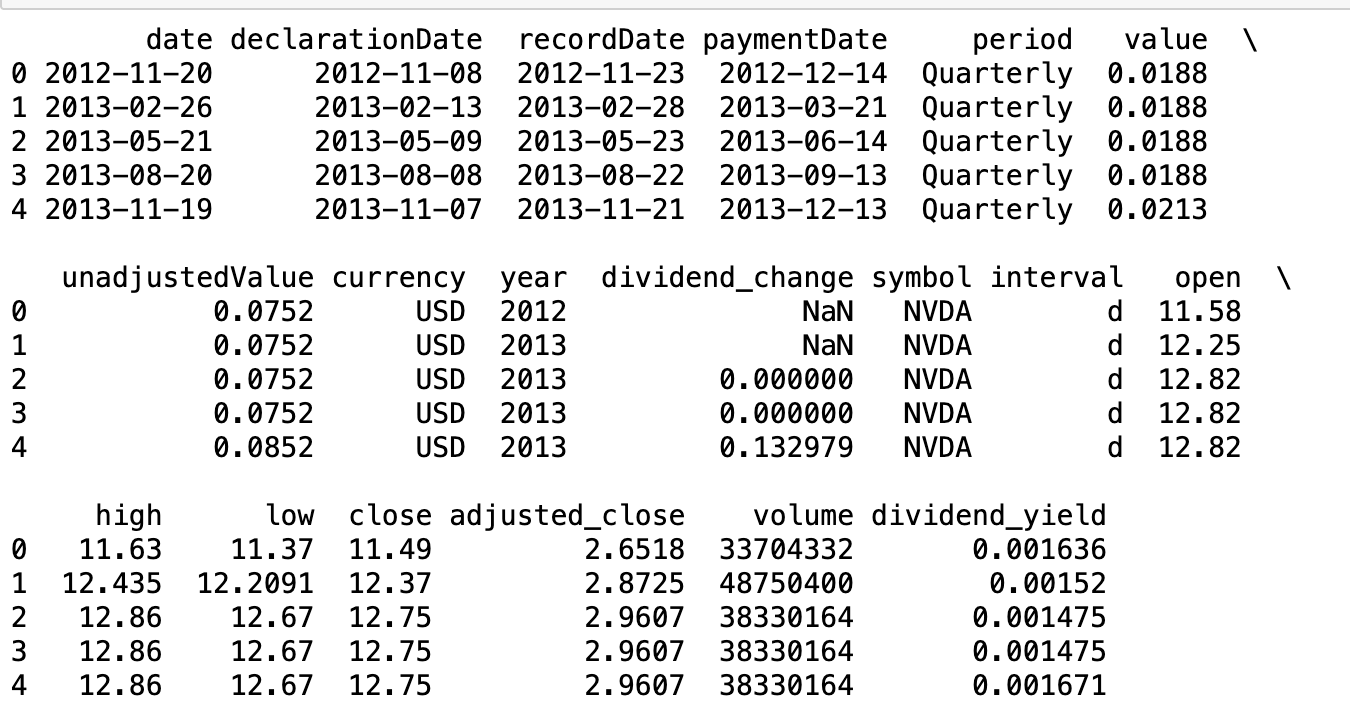
In the end, we have all the necessary metrics that can help us in further analysis.
Exploring Future Possibilities in Dividend Analysis
As we have explored the in-depth process of calculating key financial metrics like dividend yield, payout ratio, and dividend growth rate, we’ve formed a solid foundation for advanced dividend analysis.
With the help of these metrics, we can now perform the various following analysis:
- Trend Analysis and Forecasting:
Evaluating historical patterns and predicting future dividend behaviors, potentially incorporating machine learning and deep learning models. - Comparative Analysis:
Benchmarking against industry standards or competitors to gauge a company’s performance relative to its peers. - Dividend Sustainability Studies:
Assessing the long-term viability of a company’s dividend policy based on its payout ratio and financial stability. - Risk Assessment:
Identifying potential risks in dividend cuts or inconsistencies and understanding the underlying causes. - Portfolio Optimization:
Integrating these insights into investment strategies to build a dividend-focused portfolio that aligns with specific investment goals.
In our upcoming articles, we will deep dive into these analysis using python programming, financial data analysis, and deep learning techniques.