eodhdR2 is the official EODHD package for R, written by Prof. Marcelo S. Perlin. It wraps our REST API in 60 functions that return tidy data frames: end-of-day and intraday prices, dividends and splits, fundamentals and financial statements, live quotes, technical indicators, a stock screener, search, options, index composition, calendars, macroeconomic and fixed-income series, sanctions lists, news and sentiment. The current release is 0.8, published on CRAN on 22 September 2026.
R is an open-source language with a large following in quantitative finance, thanks to its statistical toolbox and its plotting libraries. This guide covers installation, authentication, everything the package covers, what the main functions cost in API calls, and a full worked example on Apple (AAPL). All outputs shown below were produced with eodhdR2 0.8 on 24 September 2026 — your row counts will be slightly higher as the data set grows.
Our first-generation R package, eodhd, was archived by CRAN on 3 September 2024 and can no longer be installed with install.packages(). If you are still using it, migrate to eodhdR2 — it is the package described on this page and the one we maintain.
Installation
You need R itself and, optionally, an editor. The suggested setup is:
- Install the latest R for your platform (Windows, macOS or Linux) from cran.r-project.org.
- Install RStudio, or use R inside VS Code if you prefer.
Then install the package from the R console. Note the function name is install.packages, with an “s”:
# stable version, from CRAN
install.packages("eodhdR2")

# development version, from GitHub
if (!require(devtools)) install.packages("devtools")
devtools::install_github("EodHistoricalData/R-Library-for-financial-data-2024")
This pulls in the package’s dependencies — dplyr, tidyr, readr, lubridate, cli and others. On a machine with no compiled binaries available it may take several minutes. Once it finishes, load the package:
library(eodhdR2)If that runs without an error, the package is installed correctly. The source code and the issue tracker are on our GitHub page — watch the repository to be notified about new releases.
Activating the API
Register an account at eodhd.com, then open your dashboard and copy your API token. The token is tied to your subscription: a Fundamentals-only plan will not return price data, and vice versa. Our plans start at €19.99 per month, and the All-In-One plan covers every endpoint the library talks to.
Authentication is handled once per R session with set_token():
# set your own token
eodhdR2::set_token("YOUR_API_TOKEN")
If you are logged in, the box below shows your own key in the request — use that value in set_token():
https://eodhd.com/api/user?api_token=demo&fmt=jsoncurl --location "https://eodhd.com/api/user?api_token=demo&fmt=json"$curl = curl_init();
curl_setopt_array($curl, array(
CURLOPT_URL => 'https://eodhd.com/api/user?api_token=demo&fmt=json',
CURLOPT_RETURNTRANSFER => true,
CURLOPT_ENCODING => '',
CURLOPT_MAXREDIRS => 10,
CURLOPT_TIMEOUT => 0,
CURLOPT_FOLLOWLOCATION => true,
CURLOPT_HTTP_VERSION => CURL_HTTP_VERSION_1_1,
CURLOPT_CUSTOMREQUEST => 'GET',
));
$data = curl_exec($curl);
curl_close($curl);
try {
$data = json_decode($data, true, 512, JSON_THROW_ON_ERROR);
var_dump($data);
} catch (Exception $e) {
echo 'Error. '.$e->getMessage();
}import requests
url = f'https://eodhd.com/api/user?api_token=demo&fmt=json'
data = requests.get(url).json()
print(data)library(httr)
library(jsonlite)
url <- 'https://eodhd.com/api/user?api_token=demo&fmt=json'
response <- GET(url)
if (http_type(response) == "application/json") {
content <- content(response, "text", encoding = "UTF-8")
cat(content)
} else {
cat("Error while receiving data\n")
}Try it now (it's free)!
How to use it (YouTube)
You can also start with the free demo token, which returns real data for a small set of symbols: AAPL.US, MSFT.US, TSLA.US, VTI.US, AMZN.US, MCD.US, BTC-USD.CC and EURUSD.FOREX. Any other symbol answers 403 Forbidden.
token <- eodhdR2::get_demo_token()
eodhdR2::set_token(token)
✔ eodhd API token set
ℹ Account name: API Documentation 2 (supportlevel1@eodhistoricaldata.com)
ℹ Quota: 251099 | 10000000
ℹ Subscription: demo
✖ You are using a DEMONSTRATION token for testing purposes, with limited
access to the data repositories.Every function in eodhdR2 takes the ticker and the exchange as two separate arguments, so a symbol written as AAPL.US elsewhere in our documentation becomes get_prices(“AAPL”, “US”) here. The same rule applies to currency pairs: EUR-USD is get_prices(“EURUSD”, “FOREX”), not “EUR-USD”.
What the demo token covers
The demo token does not cover every function. These are the results of running each one against it on 24 September 2026:
| Function | Demo token | Notes |
|---|---|---|
| get_prices | Works | For the demo symbols only |
| get_dividends | Works | For the demo symbols only |
| get_fundamentals | Works | For the demo symbols only |
| get_intraday | Works | For the demo symbols only |
| get_news | Works | For the demo symbols only |
| get_real_time | Works | For the demo symbols only |
| get_splits | Paid token required | The library returns an explicit error |
| get_exchanges | Paid token required | The library returns an explicit error |
| get_tickers | Paid token required | The library returns an explicit error |
| get_ipos | Paid token required | The API answers 403 Forbidden |
| get_screener | Paid token required | The API answers 403 Forbidden |
The rule of thumb: the demo token opens the endpoints a free trial would show you, on a handful of symbols. Everything else — the screener, the calendars, options, macro and credit-risk series — needs a paid token.
API calls per function
Each function spends API calls from your daily quota. The figures below were measured by reading the usage counter before and after each call — see API Limits for how the quota works.
| Function | What it returns | API calls |
|---|---|---|
| get_prices | Daily OHLCV with adjusted close, full history | 1 |
| get_dividends | Dividend history | 1 |
| get_splits | Split history | 1 |
| get_fundamentals | Raw fundamentals as a nested list | 10 |
| parse_financials | Financial statements as a data frame | 0 — works on data already downloaded |
| get_intraday | Intraday OHLCV bars | 5 |
| get_news | Company news | 5 per page — see below |
| get_ipos | IPO calendar | 1 |
| get_exchanges | List of supported exchanges | 1 |
| get_tickers | All tickers of one exchange | 1 |
| get_real_time | Delayed live quote | 1 per ticker |
| get_technical | One technical indicator series | 5 |
| get_search | Ticker and company search | 1 |
| get_demo_token, set_token, get_user_info | Authentication and account helpers | 0 |
get_news() pages through results automatically, 500 headlines at a time, and each page costs 5 API calls. A two-week window on AAPL returned 643 headlines over two pages, plus one more request that found nothing left, so it cost 15 calls in total. Every call also prints your remaining quota, so you can watch the counter as you work. The functions added in 0.7 cost whatever their endpoint costs — the per-endpoint figures are in API Limits, and get_user_info() reads your counter back at any point without spending a call.
What the package covers
Version 0.7 grew the package from twelve functions to sixty, and 0.8 fixed the bugs that pass uncovered. Almost every endpoint of our REST API now has an R wrapper, grouped as follows:
| Group | Functions |
|---|---|
| Prices | get_prices, get_intraday, get_ticks, get_real_time, get_us_quote_delayed, get_bulk_eod |
| Corporate actions | get_dividends, get_splits, get_symbol_change_history |
| Fundamentals | get_fundamentals, parse_financials, get_bulk_fundamentals, get_historical_market_cap, get_insider_transactions |
| Calendars | get_earnings, get_earnings_trends, get_dividends_calendar, get_splits_calendar, get_ipos, get_economic_events |
| Reference data | get_exchanges, get_exchange_details, get_tickers, get_search, get_id_mapping, get_index_list, get_index_composition |
| Screening and signals | get_screener, get_technical |
| News and sentiment | get_news, get_sentiments, get_news_word_weights |
| Options | get_options_contracts, get_options_eod, get_options_underlyings |
| Macro and rates | get_macro_indicator, get_policy_rates, get_reference_rates, get_ust_rates, get_commodities |
| Credit risk | get_sovereign_cds_spreads, get_sovereign_credit_ratings, get_sovereign_risk_premium, get_cds_market_aggregates, get_default_spreads, get_corporate_cmdi, get_corporate_hqm_yields, get_funding_stress_spreads |
| Real estate | get_real_estate, get_real_estate_countries, get_real_estate_detailed, get_real_estate_series |
| Sanctions | get_sanctions_entities, get_sanctions_programs, get_sanctions_sources, get_sanctions_vessels |
| Account and escape hatch | set_token, get_demo_token, get_user_info, get_eodhd |
get_eodhd() is the escape hatch: it takes any endpoint path and any set of parameters, and returns a data frame, so an endpoint we add tomorrow is reachable before it gets its own wrapper.
Every function is documented inside R. To read the arguments and the return value of any of them, use the help command:
help(get_prices)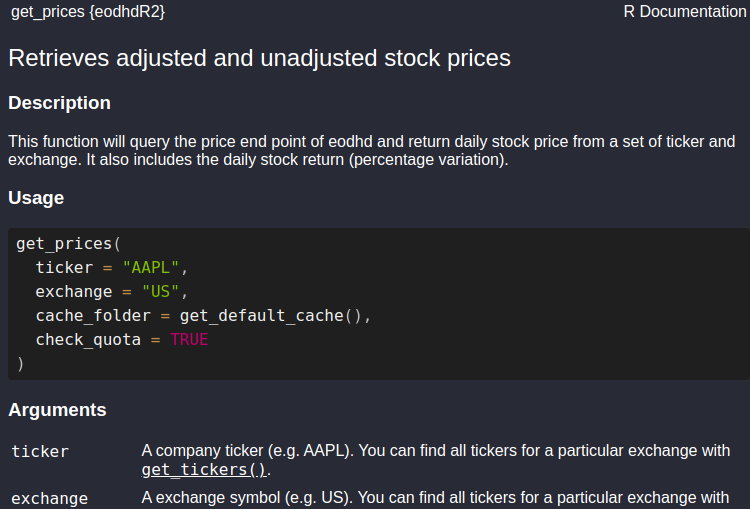
Here is one call for each of the core functions, with the number of rows we got back on 24 September 2026 using a paid token:
library(eodhdR2)
set_token("YOUR_API_TOKEN")

prices  <- get_prices("AAPL", "US")                    # 11,537 rows, 1980-12-12 to 2026-09-23
divs    <- get_dividends("AAPL", "US")                 # 92 rows
splits  <- get_splits("AAPL", "US")                    # 5 rows
l_fun   <- get_fundamentals("AAPL", "US")              # list of 13 elements
fin     <- parse_financials(l_fun, "long")             # 71,280 rows
intra   <- get_intraday("AAPL", "US", "5m")            # 395 five-minute bars, last 7 days
news    <- get_news("AAPL", "US",
                    first_date = Sys.Date() - 14)      # 643 headlines
ipos    <- get_ipos(first_date = Sys.Date() - 30)      # 108 IPOs
exch    <- get_exchanges()                             # 70 exchanges
tickers <- get_tickers("US")                           # 51,084 US tickers
Supported intraday frequencies are 1m, 5m and 1h, subject to the retention windows described in the Intraday Historical Data API documentation. parse_financials() accepts “long” or “wide” as its second argument; the wide table for AAPL is 594 rows by 127 columns.
Until version 0.7, get_intraday() ignored its first_date and last_date arguments and returned the whole retention window. From 0.7 the dates are honoured, and the default window is the past seven days — pass first_date and last_date when you want more.
Worked example: Apple (AAPL)
Everything in this section runs with the demo token, except for the splits example. Apple trades on the US market, so the ticker is “AAPL” and the exchange is “US”.
Retrieving prices
ticker   <- "AAPL" # AAPL is the ticker for Apple Inc
exchange <- "US"   # AAPL trades on the US market

# fetch prices from the eodhd end-of-day endpoint
df_prices <- eodhdR2::get_prices(ticker, exchange)
── retrieving price data for ticker AAPL|US ──
ℹ cache file AAPL_US_eodhd_prices.rds saved
✔ got 11537 rows of prices
ℹ got daily data from 1980-12-12 to 2026-09-23# check the result
dplyr::glimpse(df_prices)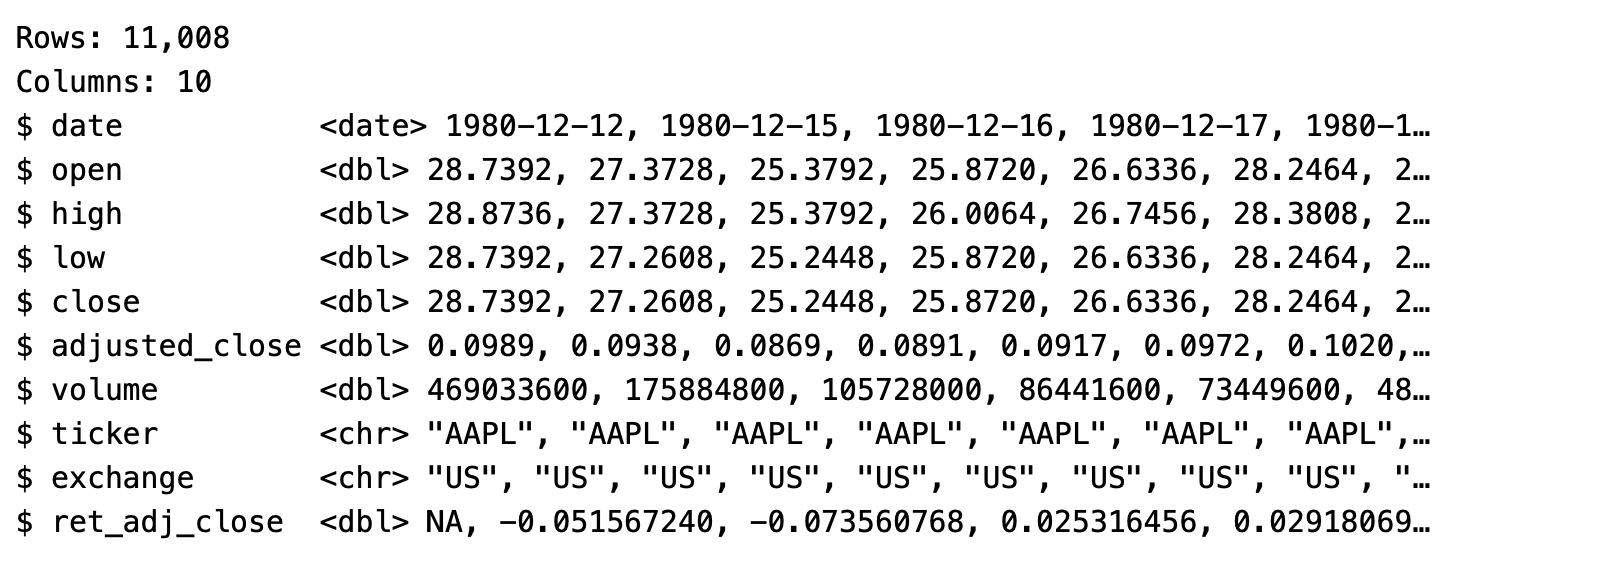
Now let’s use ggplot2 to plot the adjusted price series of the past five years:
library(ggplot2)

first_date <- Sys.Date() - 5*365 # last 5 years
last_date  <- Sys.Date()

df_prices <- df_prices |>
  dplyr::filter(
    date >= first_date,
    date <= last_date
    )

p <- ggplot(df_prices, aes(y = adjusted_close, x = date)) +
  geom_line() +
  theme_light() +
  labs(title = "Adjusted Prices of AAPL",
       subtitle = "Prices are adjusted to splits, dividends and other corporate events",
       x = "Date",
       y = "Adjusted Prices",
       caption = "Data obtained with package eodhdR2")

p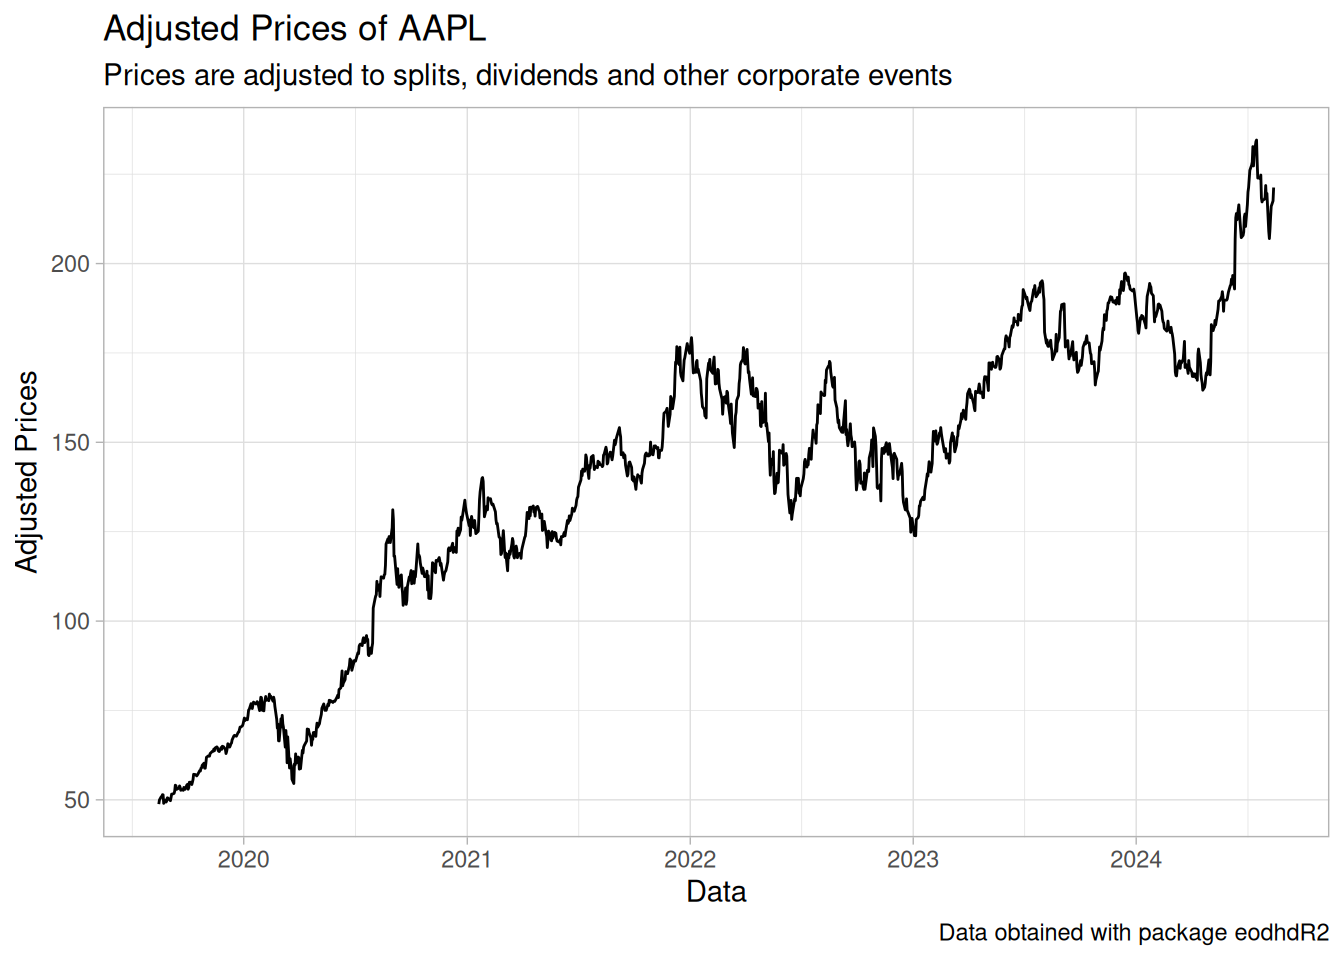
Retrieving dividends
The same interface returns the dividend history:
# fetch data from the dividends endpoint and filter for dates
df_div <- eodhdR2::get_dividends(ticker, exchange) |>
  dplyr::filter(
    date >= first_date,
    date <= last_date
    )
── retrieving dividends for ticker AAPL|US ──
ℹ cache file AAPL_US_eodhd_dividends.rds saved
✔ got 92 rows of dividend data# check the data
dplyr::glimpse(df_div)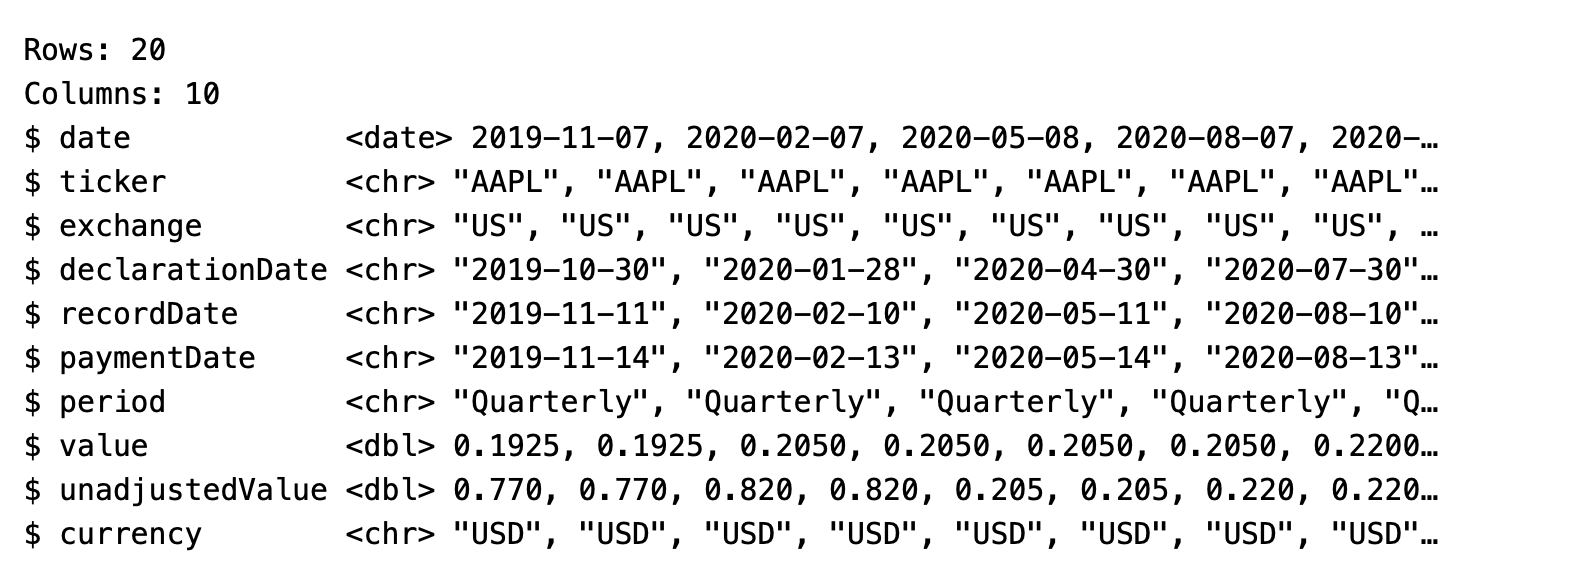
And the dividend history as a chart:
p <- ggplot(df_div, aes(y = value, x = date)) +
  geom_point(size = 2) +
  theme_light() +
  labs(title = "Adjusted Dividends of AAPL",
       x = "Date",
       y = "Adjusted Dividends")

p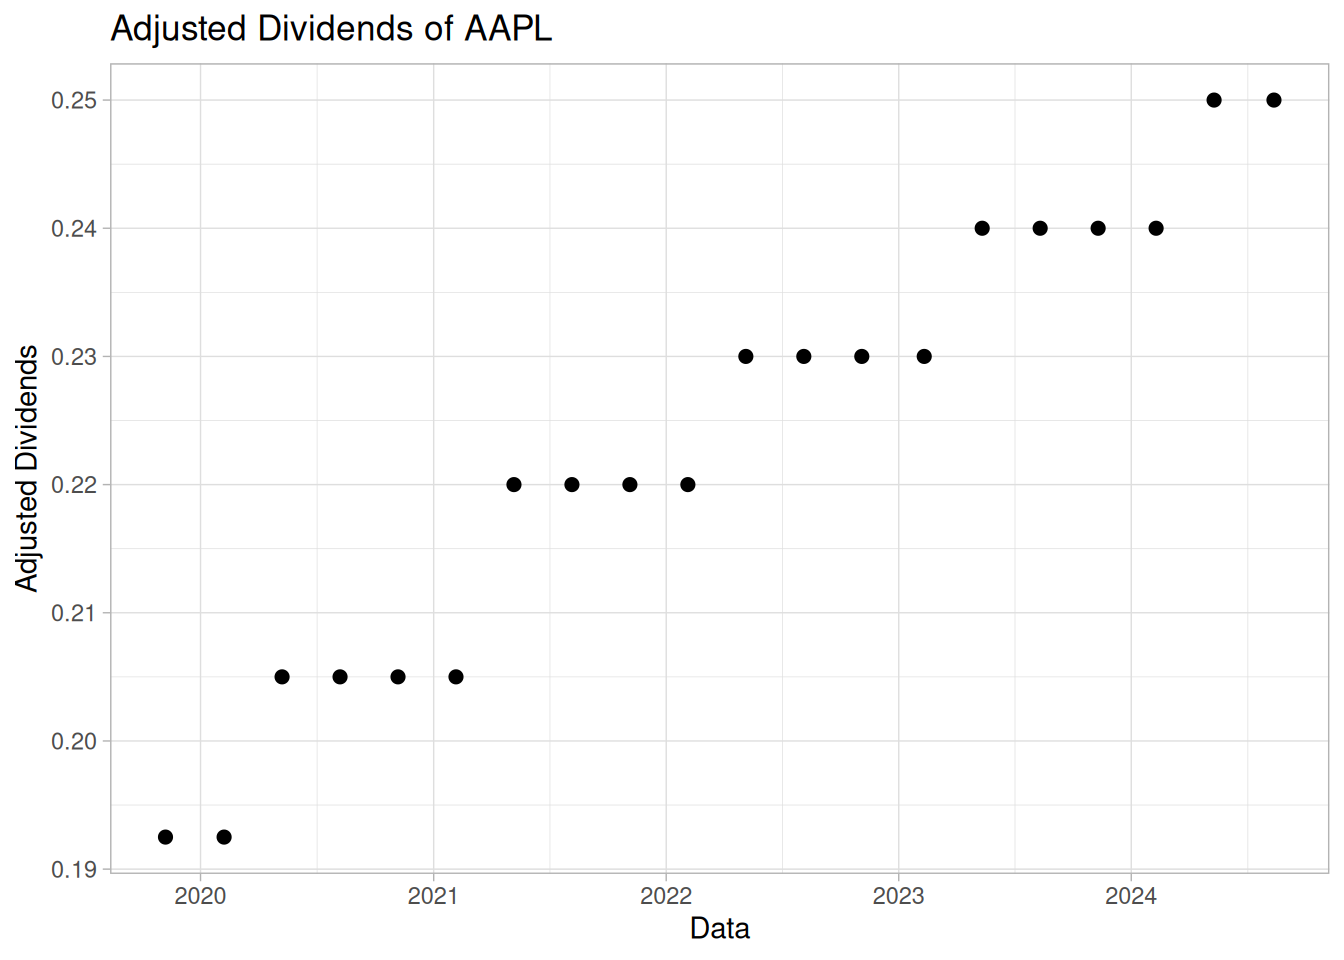
Retrieving splits
Splits need a paid token. Apple has split its stock five times:
df_splits <- eodhdR2::get_splits(ticker, exchange)
df_splits
date ticker exchange split
1 1987-06-16 AAPL US 2.000000/1.000000
2 2000-06-21 AAPL US 2.000000/1.000000
3 2005-02-28 AAPL US 2.000000/1.000000
4 2014-06-09 AAPL US 7.000000/1.000000
5 2020-08-31 AAPL US 4.000000/1.000000Retrieving fundamentals
Fundamental data arrives as a nested list, the same structure our Fundamental Data API returns as JSON:
# fetch the data
l_fun <- eodhdR2::get_fundamentals(ticker, exchange)

# the result is a list — check its content
names(l_fun)
── retrieving fundamentals for ticker AAPL|US ──
✔ querying API
✔ got 13 elements in raw list
[1] "General" "Highlights" "Valuation"
[4] "SharesStats" "Technicals" "SplitsDividends"
[7] "AnalystRatings" "Holders" "InsiderTransactions"
[10] "ESGScores" "outstandingShares" "Earnings"
[13] "Financials"Parsing financials
parse_financials() turns the raw list into a data frame. It downloads nothing, so it costs no API calls:
type_table <- "long" # "long" or "wide"

# l_fun is the output of eodhdR2::get_fundamentals()
long_financials <- eodhdR2::parse_financials(l_fun, type_table)

# check contents
head(long_financials)
── Parsing financial data for Apple Inc. | AAPL ──
ℹ parsing Balance_Sheet data
ℹ quarterly
ℹ yearly
ℹ parsing Cash_Flow data
ℹ quarterly
ℹ yearly
ℹ parsing Income_Statement data
ℹ quarterly
ℹ yearly
✔ got 71280 rows of financial data (long format)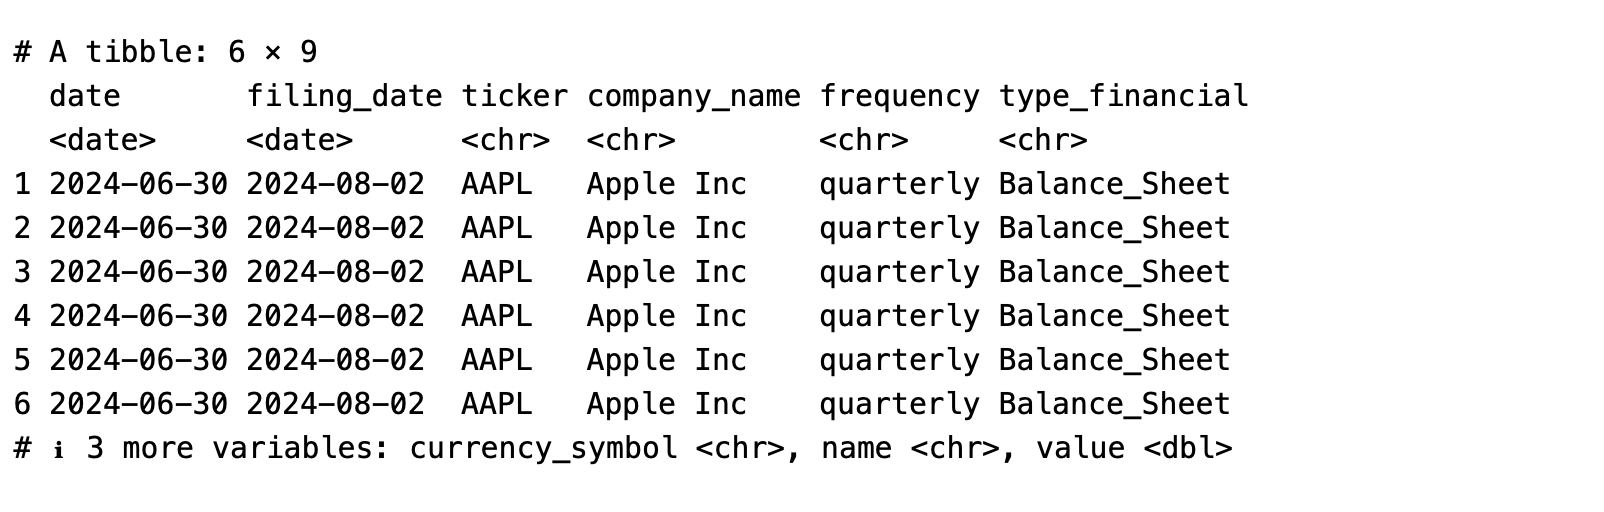
The last quarterly balance sheet of AAPL
With the financials in a data frame, a report of the latest quarterly balance sheet is a few lines of dplyr and gt:
quarterly_bs <- long_financials |>
  dplyr::filter(
    frequency == 'quarterly',
    type_financial == "Balance_Sheet"
  )

last_date <- max(quarterly_bs$date)

last_bs <- quarterly_bs |>
  dplyr::filter(date == last_date)

last_bs |>
  dplyr::select(date, name, value) |>
  na.omit() |>
  gt::gt() |>
  gt::tab_header(
    title = paste0("Balance Sheet of AAPL (", last_date,")"),
    subtitle = paste0("Data from eodhd (values in thousands USD)")
  ) |>
  gt::fmt_currency(value, scale_by = 1/1000)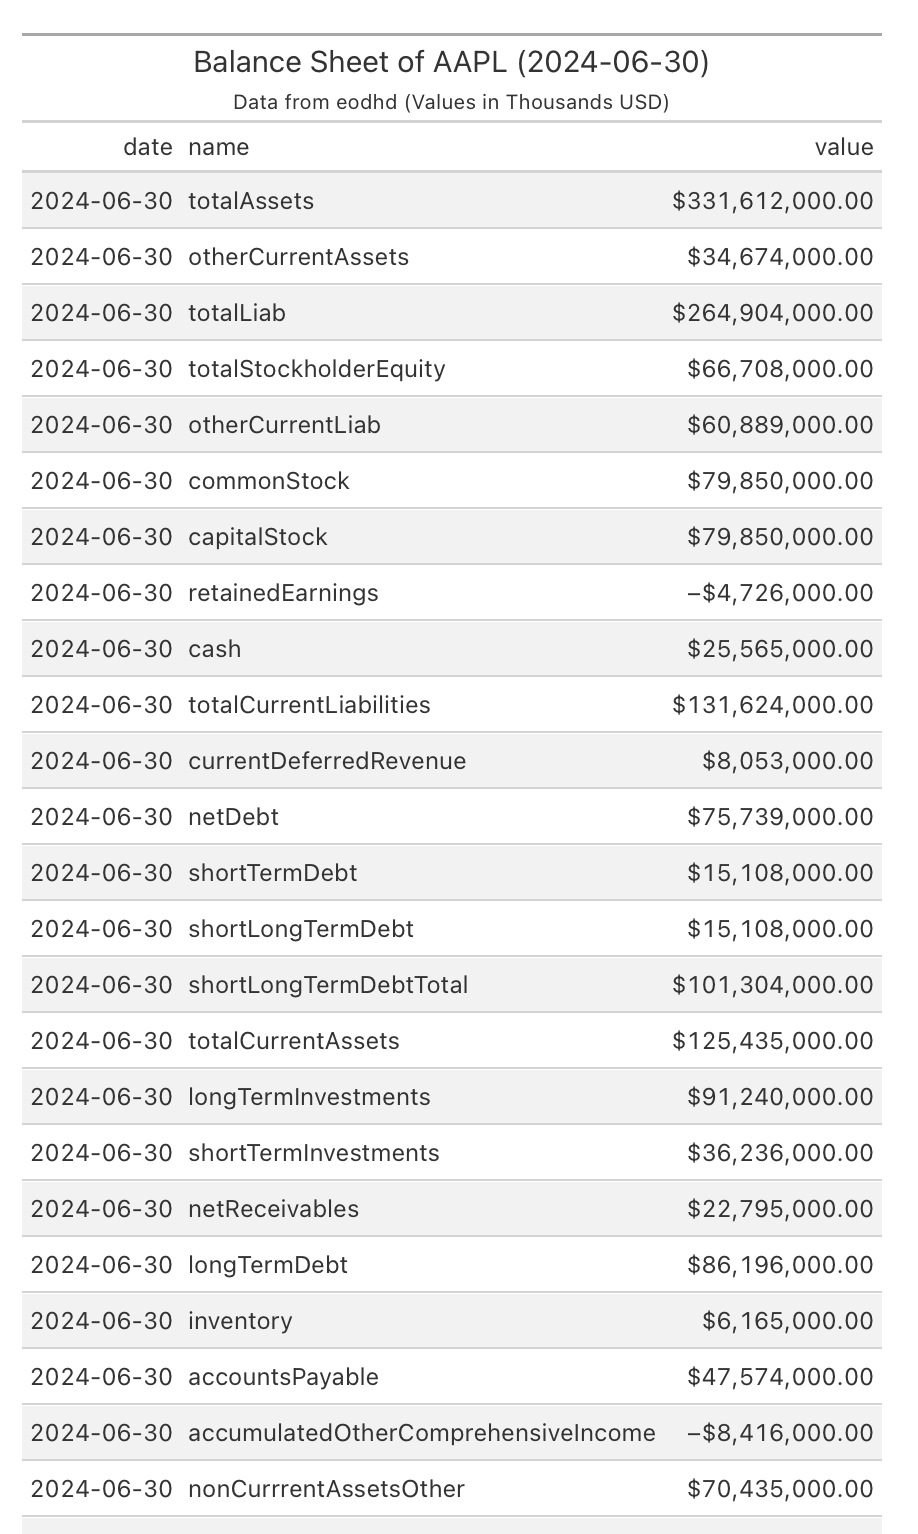
Intraday prices, news and IPOs
These three were the first additions after the original release of this guide, and 0.7 fixed the date handling of get_intraday(): the window you ask for is the window you get.
# five-minute bars; without dates you get the past seven days
intra <- eodhdR2::get_intraday("AAPL", "US", frequency = "5m")

# or ask for an explicit window
intra <- eodhdR2::get_intraday("AAPL", "US", frequency = "5m",
                               first_date = Sys.Date() - 3,
                               last_date  = Sys.Date())

dplyr::glimpse(intra)
The data frame carries timestamp, gmtoffset, datetime, open, high, low, close, volume, ticker and exchange. On 24 September 2026 the default seven-day window held 395 five-minute bars for AAPL, from 17 September 13:30 to 23 September 20:00 UTC; the three-day window held 237.
# company news for the past two weeks
news <- eodhdR2::get_news("AAPL", "US", first_date = Sys.Date() - 14)

# IPOs of the past 30 days — needs a paid token
ipos <- eodhdR2::get_ipos(first_date = Sys.Date() - 30)
get_news() returns the headline, the full text, the sentiment scores and the related tickers of each article, the same payload as the Financial News API. For the two weeks to 24 September 2026 it returned 643 headlines on AAPL. get_ipos() covers the same calendar as the Calendar API — 108 IPOs in the preceding 30 days.
Beyond prices and fundamentals
The functions added in 0.7 follow the same conventions — ticker and exchange as separate arguments, a tidy data frame back, the answer cached on disk. A few of them, run on 24 September 2026:
# delayed live quote — 1 row: code, timestamp, gmtoffset, OHLC,
# volume, previousClose, change, change_p
quote <- eodhdR2::get_real_time("AAPL", "US")

# a technical indicator, computed server side
sma <- eodhdR2::get_technical("AAPL", "US", indicator = "sma", period = 50,
                              first_date = Sys.Date() - 365)   # 202 rows

# search by name, ticker or ISIN
hits <- eodhdR2::get_search("apple", limit = 5)                # 5 rows

# screen the whole universe by fundamentals and price
big <- eodhdR2::get_screener(
  filters = list(c("market_capitalization", ">", 100000000000)),
  sort    = "market_capitalization.desc",
  limit   = 5)

# daily news sentiment
sent <- eodhdR2::get_sentiments("AAPL.US", first_date = Sys.Date() - 7)

# index composition, current and historical
l_idx <- eodhdR2::get_index_composition("GSPC.INDX")
# list of 3: info, current_components (503 rows), historical_components (822 rows)
get_technical() asks the API for the indicator over the window you give it, and an indicator needs a warm-up: a 50-day moving average over a 30-day window returns zero rows. Request a window comfortably longer than the period.
Note that get_index_composition() takes the full symbol with its exchange, “GSPC.INDX”, not the two separate arguments the price functions use. When an endpoint has no wrapper yet, get_eodhd() reaches it directly:
df <- eodhdR2::get_eodhd("eod/AAPL.US", params = list(from = "2026-09-01"))
# 16 rows: date, open, high, low, close, adjusted_close, volume
Options, macroeconomic series, treasury and policy rates, sovereign credit risk, real estate and the sanctions lists work the same way — the full list is in the table above, and each function has its own help page in R.
Caching
Every data function caches its answer on disk and reuses it when you repeat the same call, which keeps your quota intact while you iterate. Live quotes are the exception: get_real_time() and get_us_quote_delayed() are never cached, because a cached quote is a wrong quote. By default the cache lives in R’s temporary folder and disappears when you close the session. To keep it between sessions, pass a folder of your own:
prices <- eodhdR2::get_prices("AAPL", "US", cache_folder = "eodhd-cache")A cached file is never refreshed automatically. Delete it — or point the function at a different folder — when you want new data.
Related APIs and libraries
- End-of-Day Historical Data API — the endpoint behind get_prices(), with every parameter it supports.
- Fundamental Data API — the structure of the list get_fundamentals() returns, field by field.
- Splits and Dividends API — the endpoints behind get_splits() and get_dividends().
- Intraday Historical Data API — supported frequencies and how far back each one goes.
- Live (Delayed) Stock Prices API — the quote get_real_time() returns and how delayed it is per exchange.
- Technical Indicators API and Stock Market Screener API — every indicator and every filter get_technical() and get_screener() accept.
- Search API — the matching rules behind get_search().
- Python library and Google Sheets and Excel add-ons — the same data outside R.
- API Limits — how requests, API calls and daily quotas are counted.
If something on this page does not match what you see in your R session, write to support@eodhistoricaldata.com, or open an issue on the package’s GitHub tracker.